Is DEI Destroying Free Speech on Campus?
In the first-ever empirical study of the question, I show evidence that larger DEI bureaucracies often hurt and almost never help the speech climate on college campuses.
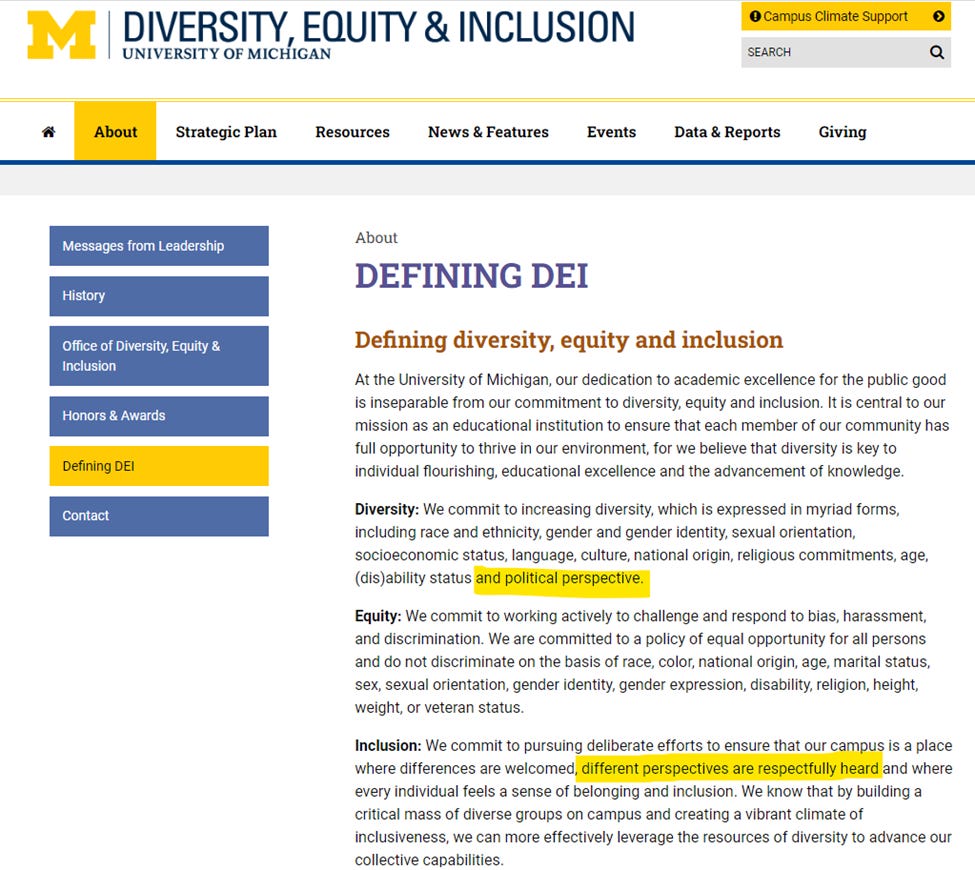
Over the last five years, the promotion of diversity, equity, and inclusion (DEI) has become a “central concern of higher education” in the United States. On its face, this “new trinity of American higher education” sounds like a virtuous (and long overdue) set of governing principles. Indeed, anyone researching DEI on college campuses would be hard-pressed to find any objectionable material on university websites. To take just one example, consider the definitions of DEI offered by the University of Michigan’s Office of Diversity, Equity, and Inclusion:
Here, “diversity” is defined (partly) as a commitment to representing a variety of “political perspectives” and “inclusion” is defined as a commitment to making sure these “different perspectives are respectfully heard.” When defined in this way, DEI sounds like a bedrock institutional commitment and operational blueprint for protecting free speech on campus. It would not be unreasonable, therefore, to expect that the increasing size and significance of university DEI bureaucracies might significantly improve the speech climates on college campuses.
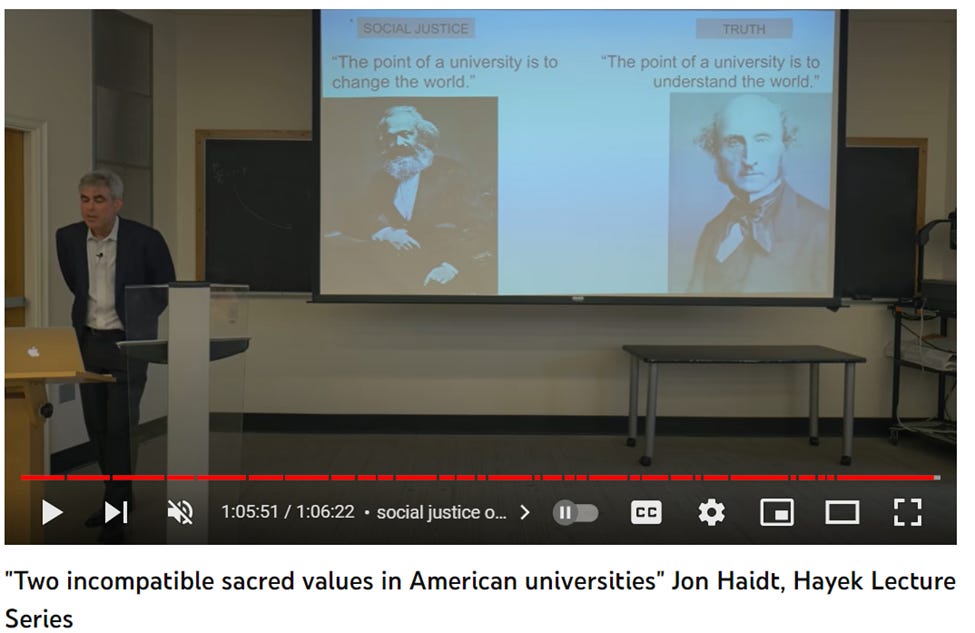
Yet, the rise of DEI bureaucracies has actually coincided with the beginning of a “Free-Speech Crisis on College Campuses.” Careful observers of American higher education saw the tension between DEI and free speech early on. Most notably, in a 2016 lecture, Jonathan Haidt pointed out that universities were now attempting to simultaneously pursue “two incompatible sacred values”: truth and social justice. Haidt argued for a schism in higher education, with universities explicitly adopting either a John Stuart Mill-style commitment to the pursuit of truth through unfettered speech or a Karl Marx-ian commitment to the pursuit of “social justice” (even if it occurred at the expense of free expression). Although Haidt did not mention them explicitly, DEI bureaucracies were clearly implicated in his discussion (as they had become the primary institutional vehicles for pursuing the “social justice” values of “diversity” and “equity”). In other words, it was clear from the start that, regardless of what was on their websites, DEI bureaucracies were more likely to suppress than encourage free expression on college campuses.
More recent rhetoric about DEI’s negative impact on free expression is far more direct. In a 2021 Newsweek editorial, for example, Professors Dorian Abbot and Ivan Marinovic argued that:
“American universities are undergoing a profound transformation that threatens to derail their primary mission: the production and dissemination of knowledge. The new regime is titled "Diversity, Equity, and Inclusion" or DEI, and is enforced by a large bureaucracy of administrators. Nearly every decision taken on campus, from admissions, to faculty hiring, to course content, to teaching methods, is made through the lens of DEI.”
Striking a similar tone in a Wall Street Journal op-ed (entitled “How ‘Diversity’ Turned Tyrannical),” Lawrence Krauss wrote that DEI had created “a climate of pervasive fear on campus” that was shutting down vitally important discussions. According to Krauss, “The DEI monomania has contributed to the crisis of free speech on campus.”
In a more recent piece from 2023, entitled “How DEI Is Supplanting Truth as the Mission of American Universities,” John Sailer claims that “the concepts of DEI have become guiding principles in higher education, valued as equal to or even more important than the basic function of the university: the rigorous pursuit of truth.” According to Sailer, “the entire experience of higher education—from earning a college degree to seeking a career in academia—now requires saturation in the principles of DEI.” As Sailer points out, some DEI offices even now warn against “weaponizing academic freedom.” In short, DEI and free expression have now become the antithesis of each other.
Summarizing these perspectives succinctly, Colin Wright claimed that “DEI departments, statements, and initiatives must be abolished at every school and university that receives public funding. They are costly cancers that stifle free speech and viewpoint diversity. Reform is not possible without first abolishing DEI.”
Are university DEI bureaucracies really “cancers that stifle free speech and viewpoint diversity”? Surprisingly, there have been no empirical studies of these claims to date. Without empirical evidence, we cannot assess whether DEI bureaucracies have any impact on university speech climates at all. Perhaps more importantly, without empirical evidence, we cannot be precise about exactly how DEI programs are shaping free expression on college campuses. It is possible, for example, that DEI programs degrade speech environments by creating an oppressive atmosphere where students from all over the political spectrum feel equally afraid to speak for fear of bureaucratic retribution. Of course, it is also possible that DEI programs have an asymmetrical effect on speech from the right and left, with conservatives feeling their views are unfairly demonized and progressives feeling their views are tacitly endorsed by the university administration. It is also possible that DEI’s effects are found only on expression in the classroom but not outside of it. Alternatively, the opposite (i.e. DEI’s effects are not felt in the classroom but are felt outside of it) could be true. Without data, we just can’t know.
Correctly diagnosing the effects (if any) of DEI programs is a necessary condition for devising effective and appropriately targeted solutions. In the absence of empirical evidence, however, we are left only with unpersuasive rhetoric that is far more likely to obscure the truth about DEI programs than it is to reveal anything useful about them.
As I demonstrate below, more DEI personnel are, in fact, associated with notably worse attitudes toward free expression among college students. As I also show, however, DEI programs do not always matter in the ways that their critics assume. Specifically, using a combination of FIRE’s 2022 survey and the Heritage Foundation’s 2021 report “Diversity University: DEI Bloat in the Academy,” I find that larger DEI bureaucracies: (1) increase student tolerance for liberal speakers while exerting no effect on tolerance for conservative speakers; (2) raise levels of discomfort related to self-expression outside of the classroom but have little impact on self-expression inside of it; (3) encourage marginally more support for attempts to disrupt campus speech through violence, blockages, and shout-downs; and (4) leave students feeling that “open and honest” conversations are difficult on a slightly larger group of political issues.
Overall, then, there is a significant amount of evidence that DEI is bad for campus speech climates and an even greater amount of evidence that DEI does very little to promote viewpoint inclusion.
Measuring DEI in Universities: The Heritage Foundation’s “Diversity University” Data
The first (and only) cross-campus study of DEI bureaucracies was produced by Jay Greene and James Paul for the Heritage Foundation in 2021. The study, summarized in a report entitled “Diversity University: DEI Bloat in the Academy,” examined 65 universities from the “Power Five” athletic conferences: the Atlantic Coast Conference, the Big 10, the Big 12, the PAC 12, and the Southeastern Conference. According to Greene and James, the “Power Five universities tend to be mainstream institutions that students select—and state legislatures support—without much thought to their political and cultural aims.” Importantly, these 65 universities serve approximately 16% of all students enrolled in four-year universities across the United States (collectively amounting to 2.2 million students). As such, the results of this study paint a broad picture of the size and scope of DEI bureaucracies in American universities.
In order to identify the number of DEI employees working at each of these 65 schools, Greene and Paul relied on keyword searches of university websites. Specifically, they searched for terms such as “diversity,” “Multicultural Affairs,” “African American Culture,” “Asian Culture,” “Latino Culture,” “Native American Culture,” “Women’s Center,” and “LGBTQ Center.” Staff identified through these searches were added to their university’s count of DEI personnel. In an effort to “capture only the effort that these institutions want to devote to DEI, rather than what they must devote to DEI,” employees with primary responsibilities connected to Title IX, equal employment opportunity, or compliance with other legal obligations were excluded from the total count.
As the authors point out, the results produced from this study are likely an underestimate of the true size of university DEI bureaucracies. Not every DEI employee is listed on a university’s website, many employees have partial DEI responsibilities that may not be reflected in their formal titles and the list of search terms may have missed DEI personnel who are not associated with the narrow topics queried.
Even still, Green and Paul’s search procedures identified nearly 3,000 people tasked with promoting diversity, equity, and inclusion at the 65 universities of the “Power 5” conferences (for an average of 45.1 people per school). Of course, some universities have many more DEI personnel than others. The University of Michigan, for example, has 163 people working in DEI programming. Ohio State University and the University of Virginia each have 94. As Greene and Paul conclude, “Promoting DEI has become a primary function of higher education.”
The 65 schools studied by Greene and Paul were selected because they are “mainstream institutions.” Looking only at these schools, however, prevents us from analyzing how DEI may operate at more elite institutions. These elite institutions are important because: (1) they produce a disproportionate share of future leaders; (2) they serve as role models for lower-ranked universities (who might copy or mimic their policy approaches); and (3) they shape a disproportionate share of the public discourse related to higher education.
For these reasons, I decided to expand on Greene and Paul’s data by applying their template to the eight schools of the Ivy League: Harvard, Brown, Cornell, Columbia, Dartmouth, Princeton, Yale, and the University of Pennsylvania. Figures 1 and 2 show how these Ivy League schools compare to the 25 largest DEI bureaucracies in the “Power Five” conference universities.1
Figure 1 - DEI Personnel at “Power 5” Universities
Figure 2 - DEI Personnel at Ivy League Universities
Collectively, this data on university DEI bureaucracies reveals several patterns. First, private universities, on average, have relatively larger DEI staff than public universities. 14 of the top 20 universities ranked by DEI personnel per 1,000 students are private while 39 of the lowest 40 universities are public. Overall, private universities have an average of 4.5 DEI personnel per 1,000 students. By contrast, publicly funded universities have only 1.8 DEI personnel per 1,000 students.
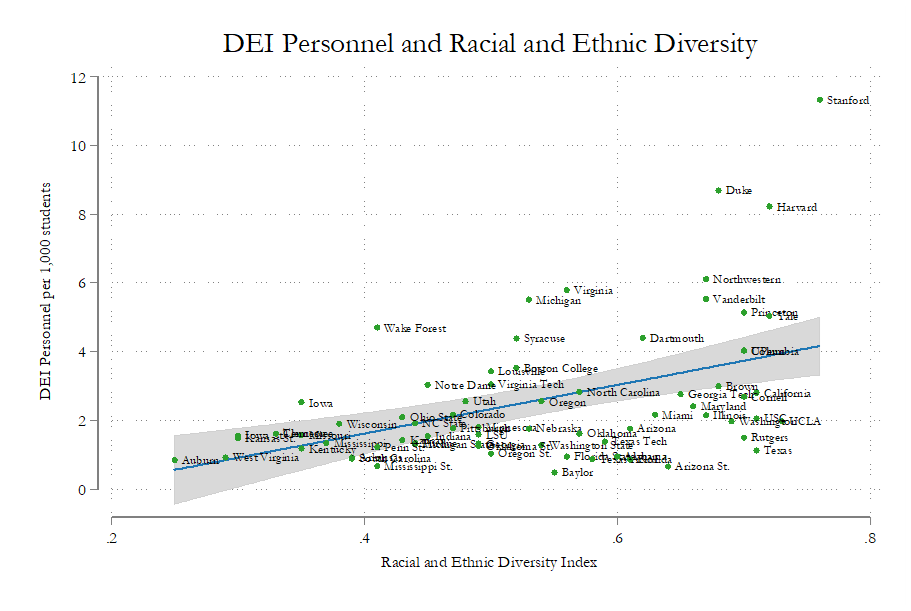
Second, increased racial and ethnic diversity among the student body is associated with larger DEI bureaucracies. Figure 3 shows the relationship between US News and World Report’s college diversity index (where scores range from 0 to 1 and higher scores indicate more diversity in the student population) and DEI personnel per 1,000 students. Higher levels of racial and ethnic diversity are highly correlated with more DEI personnel (r=.47, p=.00). The fact that more diverse campuses have more DEI employees might be a result of diverse campuses bulking up their DEI bureaucracies in an attempt to address the perceived needs of their students or a result of self-selection by non-white students into universities with more DEI services. The existing data does not let us sort these competing explanations out. For now, however, it is enough to point out that more racial and ethnic diversity tends to go along with more diversity, equity, and inclusion staff.
Figure 3 - DEI Personnel and Racial and Ethnic Diversity
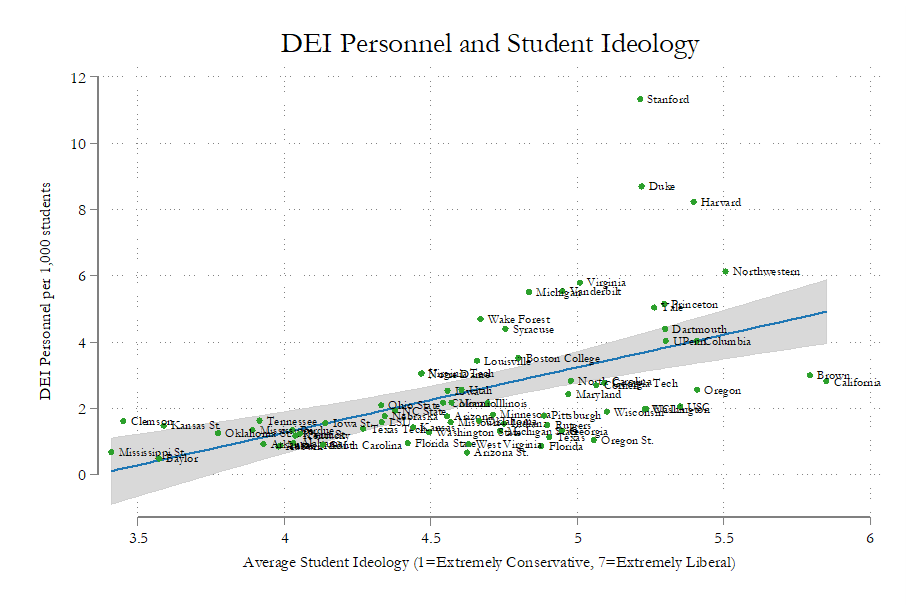
Finally, the political ideology of the student body is related to how large a university’s DEI bureaucracy is. As Figure 4 shows, universities with more liberal students (measured through the FIRE survey discussed below) have more DEI personnel (r=.54, p=.00). Once again, this relationship may be a function of liberal students demanding more DEI (and universities responding) or a function of liberal students self-selecting into universities with larger DEI bureaucracies.
Figure 4 – DEI Personnel and Student Ideology
Keeping these relationships in mind will be essential for thinking about how DEI bureaucracies shape campus speech climates. If we observe a relationship between DEI bureaucracies and speech, we will need to remember that it might be a consequence of the fact that private universities are less tolerant of speech and are, also, more likely to have bigger DEI bureaucracies. Similarly, if we find that large DEI bureaucracies make open and honest discussions of race more difficult, this could simply be a function of the fact that large DEI bureaucracies are more common at racially diverse universities. To state this more formally, we are going to need to control for these attributes of universities (and much more) to get an unbiased sense of whether DEI is helping or hurting free expression on college campuses.
Measuring Free Speech Attitudes among College Students: The FIRE Data
Each year since 2020, the Foundation for Individual Rights and Expression (FIRE) has conducted a vast, nationwide survey of college students as part of their efforts to rank the free speech climates of American universities. The 2022 survey included 45,000 enrolled students at over 200 colleges around the country. In addition to a battery of demographic (race, gender, sexual orientation, etc.) and political identity questions (e.g. political ideology, partisanship, etc.), the FIRE survey asked respondents about five, broad dimensions of free speech on campus:
Tolerance for allowing controversial speakers on campus
Comfort expressing ideas in the classroom
Comfort expressing ideas outside of the classroom
Support for disruptive action in order to prevent offensive speech
Openness to discussing challenging topics on campus
Using FIRE’s data on these five dimensions, we can provide the first-ever empirical assessment of the relationship between DEI bureaucracies and student attitudes about free expression on campus. Specifically, we can finally determine whether universities with more DEI personnel actually produce more or less “inclusive” speech climates.
In the discussion that follows, I will present the results of bivariate (i.e. the correlations between the number of DEI personnel at a university and student responses to FIRE’s questions on the five dimensions of speech) and multivariate analyses (i.e. regressions that explain variation in student responses to FIRE’s questions after controlling for a wide range of university-level variables, including the number of DEI personnel).
The bivariate correlations should be interpreted with caution. The most significant problem with bivariate analyses of any kind is that they cannot account for confounding influences. As discussed above, DEI bureaucracies are larger at private, liberal, and more racially diverse universities. If we find that DEI bureaucracies are associated with students having more negative assessments of their campus speech environments, we can’t be sure whether this is a consequence of DEI bureaucracies themselves or just spuriousness.
In order to address this problem, I will also present multivariate models that explain variation in the five dimensions of campus speech. Each of these models controls for: (1) whether the university is public or private; (2) the racial and ethnic diversity of the university (measured through US News and World Report’s diversity index); (3) the average liberal-conservative political ideology of the university’s student population (measured through a self-reported question on FIRE’s 2022 survey); (4) the average perceived ideology of the university’s faculty (measured through a question asking students to place the “average” faculty member on a liberal to conservative continuum on FIRE’s 2022 survey); (5) the extent to which the university’s formal policies comply with First Amendment standards (measured through FIRE’s speech code ratings system); and (6) the size of the university’s undergraduate population.
The problem with these multivariate models, however, is the limited sample size of universities. Currently, there are only 71 universities where we have both DEI and free speech survey data. As a result, we can’t be sure whether a statistically insignificant result is a consequence of a true null effect or a lack of statistical power.
With these caveats in mind, let’s explore the data.
The Relationship between DEI and Tolerance of Controversial Speakers
The FIRE survey asks students a series of questions to assess how tolerant they are of controversial speakers. Students were asked whether the following five speakers espousing views potentially offensive to conservatives should be allowed on campus:
The Second Amendment should be repealed so that guns can be confiscated.
Undocumented immigrants should be given the right to vote.
Getting rid of inequality is more important than protecting the so-called "right" to free speech.
White people are collectively responsible for structural racism and use it to protect their privilege.
Religious liberty is used as an excuse to discriminate against gays and lesbians
Students were also asked whether the following four speakers espousing views potentially offensive to liberals should be allowed on campus:
Abortion should be completely illegal.
Transgender people have a mental disorder.
Black Lives Matter is a hate group.
The 2020 Presidential election was stolen.
FIRE’s question asked students to state their opinion on whether these speakers should be allowed on campus independent of whether they personally agreed with the speaker’s message (“Student groups often invite speakers to campus to express their views on a range of topics. Regardless of your own views on the topic, should your school ALLOW or NOT ALLOW a speaker on campus who promotes the following idea?”). In other words, the question was attempting to measure how principled students were with respect to speech on campus.
The FIRE report summarizing the survey’s results shows wide variation in tolerance for these hypothetical speakers:
Figure 5 – FIRE’s Summary of Tolerance for Controversial Speakers
The fact that the four least tolerated speakers espouse views offensive to liberals should not be surprising. Generally, people are far more intolerant of speakers and speech that challenge what they believe to be true and college students are overwhelmingly liberal. Specifically, in the 2022 FIRE survey, an average of 49.5% of students at the 71 universities included in this analysis self-identified as liberal (compared to 23.3% that identified as conservative). Perhaps more importantly, liberal students were the plurality in 64 of the 71 universities (with conservatives constituting the plurality only at Kansas State University, the University of Mississippi, Mississippi State University, Auburn University, the University of Tennessee, Clemson University, and Baylor University). As Figure 6 shows, liberal students outnumber conservative students by more than 40% (e.g. 60% to 20%) on 22 of the 71 campuses examined here while there is not a single university where conservative students outnumber liberal students by more than 20%.
Figure 6 – Percent of Students Identifying as Liberal by University
The impact of ideology on tolerance is clear from examining the FIRE survey data at the individual level. As Figure 7 shows, liberals and conservatives are less intolerant of speakers who share their ideological predispositions. To be precise, liberal college students had an “average intolerance” score of 2.0 (where 1=the speaker should “definitely” be allowed and 4=the speaker should “definitely not” be allowed) when considering whether to allow liberal speakers on campus and conservative college students had an “average intolerance” score of 2.3 when considering whether to allow conservative speakers on campus. By contrast, liberal students had an “average intolerance” score of 3.4 when considering whether to allow conservative speakers and conservative students had an “average intolerance” score of 2.5 when considering whether to allow liberal speakers. Despite FIRE’s attempt to prime them to ignore their “own views on the topic,” in other words, students (particularly liberal students) are intolerant of those who contradict their beliefs.
Figure 7 – Intolerance of Controversial Speakers by Ideology
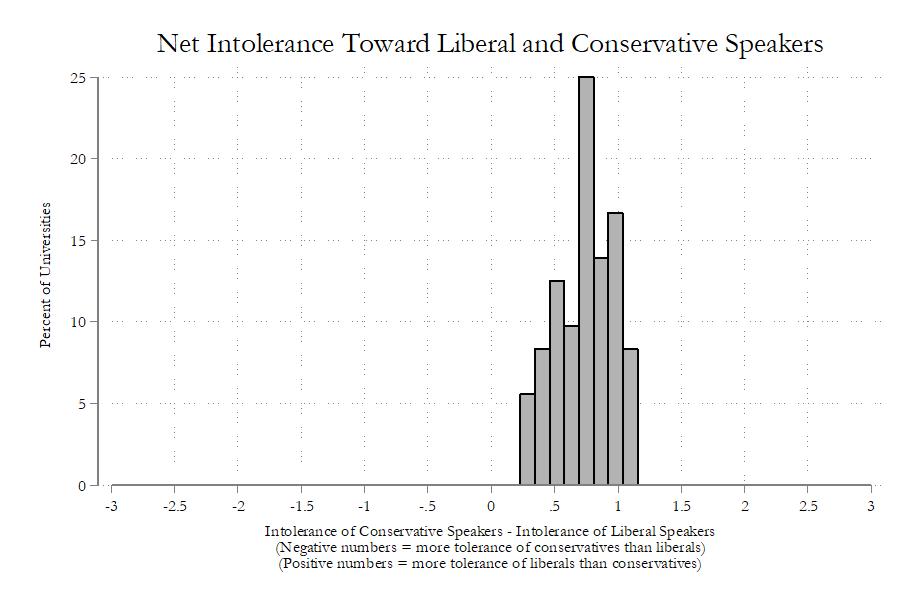
Even with this context in mind, the extent to which there is more tolerance of liberal speakers among the 71 universities studied here is striking. On every single one of the 71 campuses, there was more tolerance, on average, for liberal speakers than conservative speakers. Even at Mississippi State University and Clemson University (where conservatives outnumber liberals by nearly 20%), the average level of tolerance for liberal speakers was still greater than that of conservative speakers.
Figure 8 – Net Intolerance Toward Liberal and Conservative Speakers
Figure 8 gives us a broad sense of variation in tolerance across universities but it doesn’t help us assess whether relatively larger DEI bureaucracies increase or decrease intolerance. We can start to answer this question by looking at the average level of intolerance (i.e. the mean intolerance when left-wing and right-wing speakers are lumped together) among the 71 universities that we have both FIRE and Heritage data for. As Figure 9 shows, more DEI personnel is generally associated with less intolerance/more tolerance of controversial speakers (r=-.50, p=.00).
Figure 9 – Intolerance of Controversial Speakers
Does this mean that DEI bureaucracies are actually creating more “inclusive” speech climates for everyone? Not so fast. As Figure 10 shows, the overall reduction of intolerance is entirely a function of how DEI personnel increase tolerance for liberal speakers. Students at universities with more DEI personnel per 1,000 students are far more tolerant of liberal speakers (r=-.65, p=.00). Students at universities with more DEI personnel per student are not, however, more tolerant of conservative speakers (r=.14, p=.22).
Figure 10 – Intolerance of Liberal and Conservative Speakers
As Table 1 shows, the effect of DEI personnel is robust for intolerance of liberal speakers after adding statistical controls. Table 1 also confirms that the number of DEI personnel makes no impact on how much tolerance students will express for conservative speakers.
Table 1 – Intolerance of Liberal and Conservative Speakers
It is important to emphasize here that there is no evidence in the data that larger DEI bureaucracies increase intolerance for controversial conservative speakers. This point is an essential rejoinder to critiques of DEI that focus on the suppression of speech coming from the political right. Most of the energy behind free speech debates over the last few years has come from concerns that conservative speakers are being unfairly sanctioned for espousing their views. The typical narrative about “cancel culture” on college campuses before 2020 was that timid and ineffectual administrators were being pressured by a small group of left-wing malcontents (i.e. “social justice warriors”) into suppressing the communication of any ideas from the political right. As opposition to DEI has ramped up over the last two years, this old narrative has been supplanted with the idea that DEI bureaucracies are the primary causes of the deteriorating speech climate on college campuses. While conservatives remain the targets of censorship efforts in these accounts, explicitly hostile DEI personnel (rather than the combination of effete administrators and disgruntled leftist youth) have become the main villains of the story.
Contrary to this newly mobilized narrative, the data show that DEI bureaucracies actually work in favor of progressive ideas not by shrinking the Overton Window on the right but, instead, by expanding it on the left. To state this in more concrete terms, DEI bureaucracies appear to shape the campus speech climate not by stigmatizing ideas like “Black Lives Matter is a hate group” and “Transgender people have a mental disorder” but, instead, by normalizing ideas such as “Religious liberty is used as an excuse to discriminate against gays and lesbians” and “White people are collectively responsible for structural racism and use it to protect their privilege.” Overall, then, the “inclusion” in “Diversity, Equity and Inclusion” appears to mean more tolerance of left-wing speakers and not more tolerance of right-wing speakers.
The Relationship between DEI and Discomfort in Classroom
Let’s turn now to how DEI bureaucracies might shape the classroom environment. The good news for those who genuinely worry about its deleterious effects on education is that there’s not an immediately obvious relationship between having a relatively large DEI bureaucracy and having a more uncomfortable classroom environment. As Figure 11 shows, there is essentially no difference in how comfortable students are voicing an opinion during an in-class discussion or disagreeing with a professor (in public or in a written assignment) based on how many DEI personnel are working at a university (r=.01, p=.93). Figure 11, then, also contains some bad news for DEI supporters; namely, that more personnel ostensibly attempting to increase “inclusion” does not produce more classroom comfort for students.
Figure 11 – Discomfort Expressing Opinions in Class
The addition of controls for the campus’s racial diversity, the ideology of the student body, the ideology of the faculty, the severity of the campus’s speech codes, and the size and type (public or private) of the university does not change the story (Table 2). Based on this evidence, it appears that DEI bureaucracies have not (at least up until this point) significantly shaped the way students feel about expressing themselves in the classroom.
Table 2 – Discomfort Expressing Opinions in the Classroom
Interestingly, all of the other, non-DEI variables included in Table 2 were also uncorrelated (in either bivariate or multivariate analyses) with classroom discomfort across universities. This suggests that something not measured in this analysis might dictate how comfortable students feel in the classroom.
The most likely candidate is cross-campus variation in how earnestly professors attempt to create welcoming classroom environments. If most faculty members at a university make concerted efforts to conceal their political opinions or present competing perspectives in an even-handed fashion, it would not be surprising to find that most students are comfortable in their classrooms. By contrast, if professors aggressively proselytize their political values, many students will likely feel uncomfortable in the classroom. Unfortunately, there is no measure of faculty teaching methods (in the FIRE data or elsewhere) that might help us account for the heretofore unexplained variation in in-class comfort across universities revealed by the FIRE data. In other words, all we can conclude from the data we currently have is that larger DEI bureaucracies do not appear to negatively or positively impact the feelings of comfort students have in the classroom.
The Relationship between DEI and Discomfort Outside of the Classroom
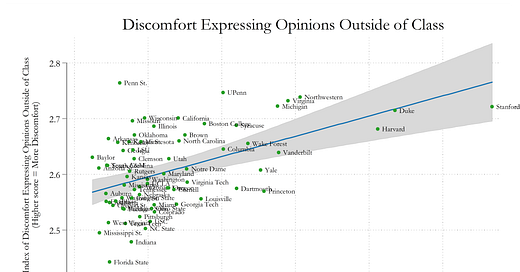
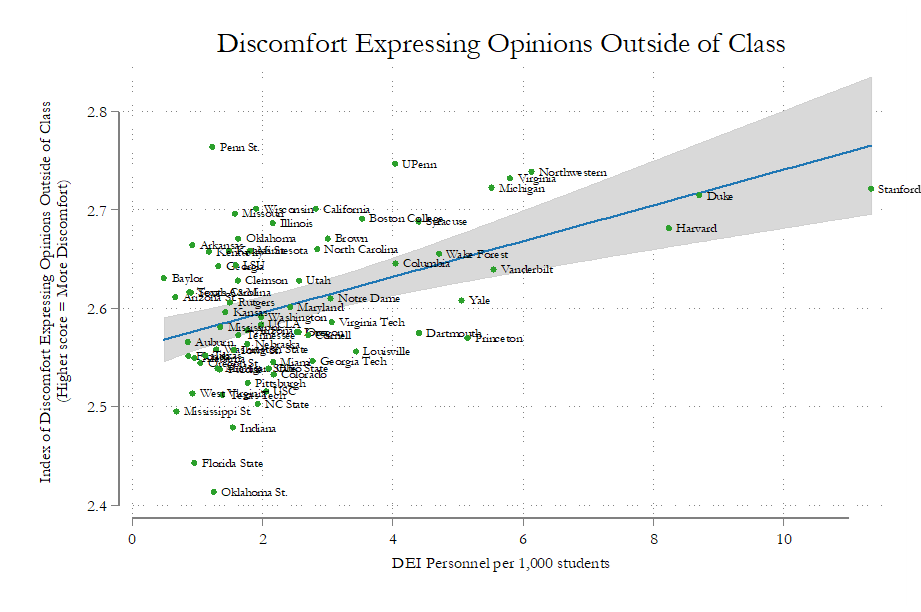
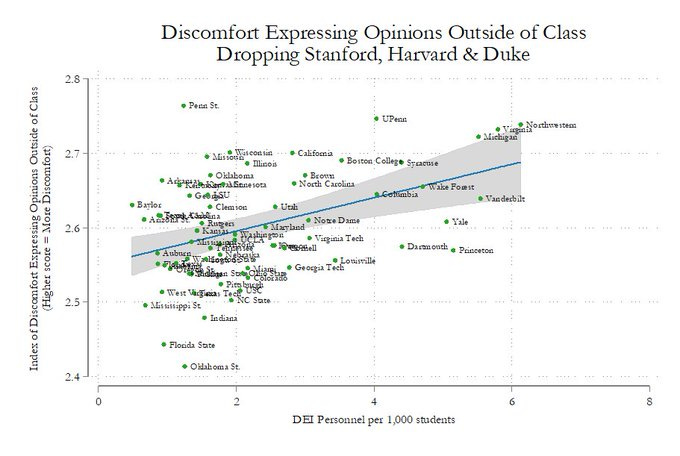
The same cannot be said, however, for how students view the speech climate of their campuses once they leave the classroom. As Figure 12 shows, the greater the relative size of the DEI bureaucracy at a university, the more discomfort students feel expressing their views on social media and in informal conversations with other students in the campus “quad, dining hall, or lounge” (r=.49, p=.00).2
Figure 12 – Discomfort Expressing Opinions Outside of the Classroom
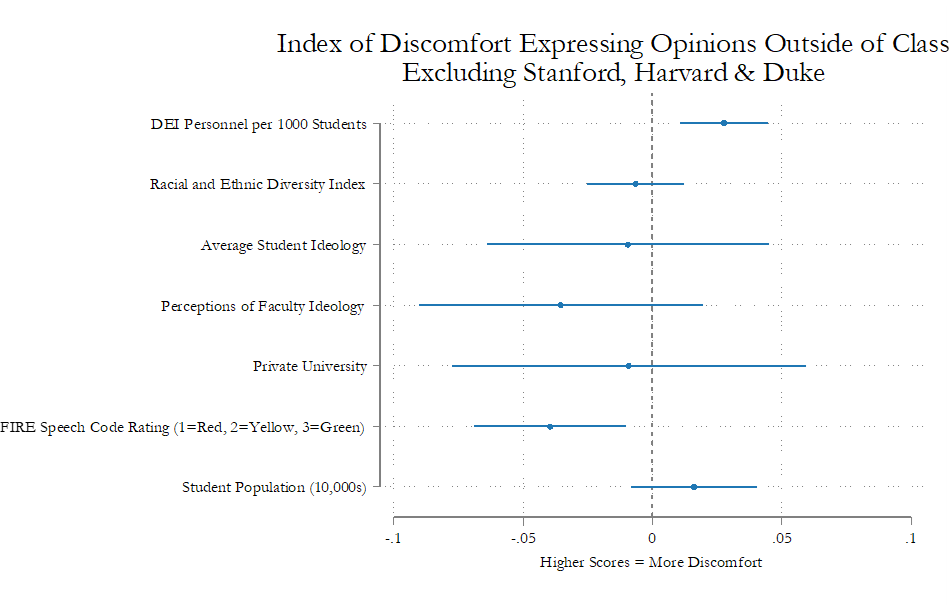
Importantly, the relationship shown in Figure 12 does not appear to be spurious.3 As Table 3 shows, the size of the DEI bureaucracy remains positively correlated with feelings of discomfort outside of the classroom even after adding the necessary group of statistical controls.
Table 3 – Discomfort Expressing Opinions Outside of the Classroom
The Relationship between DEI and Disruption
The FIRE survey asked students how acceptable it is to engage in three different methods of protest against an offensive campus speaker: “Shouting down a speaker to prevent them from speaking on campus,” “Blocking other students from attending a campus speech,” and “Using violence to stop a campus speech.” Response options ranged from “always acceptable” to “never acceptable.” In the below analyses, higher scores indicate higher levels of acceptability for disruptive behavior.
Figure 13 shows the relationship between an index of responses to FIRE’s three “disruptive” conduct questions and DEI personnel per 1,000 students. The graph suggests a strong and positive relationship between the size of a university’s DEI bureaucracy and the acceptability of disruptive conduct to prevent a controversial speech from taking place on campus, with more DEI personnel being correlated with a stronger willingness to accept disruptive behavior (r=.55, p=.00).
Figure 13 - Acceptability of Disruption to Prevent a Speech
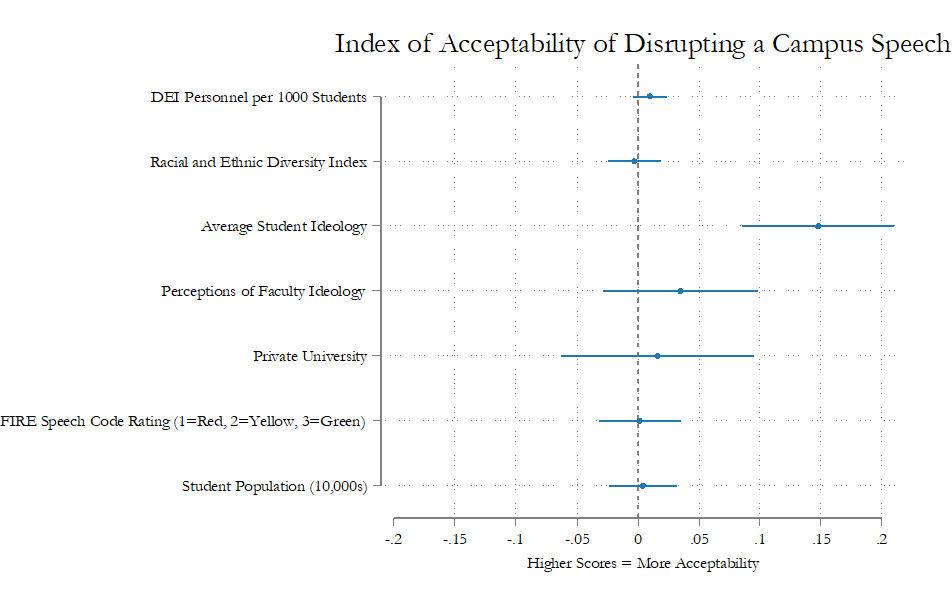
As Table 4 shows, however, the relationship between DEI personnel per 1,000 students and acceptability of disruptive behavior falls just short of traditional levels of statistical significance after controls are added. This is likely due to the fact that student ideology and the size of a university’s DEI bureaucracy are so highly correlated with each other (see above) and with support for disruption. Indeed, as Figure 14 shows, universities with more liberal students are significantly more likely to endorse disruption (r=.74, p=.00).
Table 4 – Acceptability of Disrupting a Campus Speech
Figure 14 - Acceptability of Disruption to Prevent a Speech (Student Ideology)
Unfortunately, FIRE’s questions ask about support for disruption in the abstract, undetached from a particular trigger or target. As shown above, however, the content of the speech and the identity of the speaker needs to be considered if we are hoping to get a clear sense of how much students truly support disruption. For example, if FIRE had asked students whether they support “using violence” to prevent a speech arguing “transgender people have a mental disorder,” the results would likely look much different than if they had asked students whether they support “using violence” to prevent a speech arguing “Religious liberty is used as an excuse to discriminate against gays and lesbians.” With more nuanced measures such as these, it is possible that we would discover a statistically significant relationship between DEI bureaucracies and the acceptability of disruption that parallels the relationship we identified between DEI bureaucracies and intolerance for campus speakers (i.e. universities with more DEI personnel are more likely to express tolerance for and disruption on behalf of speakers espousing progressive views).
This is speculation, however. What is not speculation is that there is a strong, bivariate correlation between the size of a university’s DEI bureaucracy and support for disruption in response to offensive speech. The fact that this relationship disappears once student ideology is controlled for might be a function of this study’s limited sample size (N=71) or might indicate that there is truly no relationship between DEI and support for disruption. The only thing we can say with confidence is that DEI probably does not reduce support for disruption and may slightly increase it.
The Relationship between DEI and Honest Conversations
The FIRE survey asked students a simple “yes” or “no” question about whether it was “difficult to have an open and honest conversation” about 17 high-profile and potentially divisive political issues (including abortion, gender inequality, racial inequality, freedom of speech, gun control, transgender issues, affirmative action, vaccine mandates, and gun control).
There are many ways of analyzing whether responses to this question correlate with the size of a university’s DEI bureaucracy. The most straightforward approach is to explore whether the average number of topics students at different universities report “difficulty” discussing is related to the number of DEI personnel a university employs. Figure 15 presents the results of this analysis.
Figure 15 – Number of Topics that are Difficult to Discuss Openly and Honestly
As Figure 15 shows, the size of a university’s DEI bureaucracy is positively correlated with the overall number of topics students find it difficult to discuss “openly and honestly” (r=.36, p=.00). Students seem, in other words, to find it challenging to talk to each other about a larger set of issues when their universities employ a relatively large number of DEI personnel.
The 17 topics that are included in the overall measure found in Figure 15, however, are a diverse and wide-ranging group. Lumping these topics together makes sense if the goal is to identify broad variation in speech climates across a wide range of issues at different universities but it’s a poor approach for answering the narrower question of how DEI bureaucracies influence free expression on college campuses. Given their stated purpose and the primary focus of their campus activity, DEI bureaucracies are far more likely to have an effect (either positive or negative) on the campus speech climate connected to identity-related issues than on matters of public policy that are not so obviously connected to race, gender, and sexual orientation. We should expect, for example, that larger DEI bureaucracies will shape how difficult students believe “open and honest” conversations are on “transgender issues” and “racial inequality” but not on “gun control” and whether China is a geopolitical threat to the United States. In other words, we need to disaggregate these 17 topics in order to truly sort out whether (and on what issues) DEI bureaucracies are hindering campus speech.
Figure 16 shows the results of breaking the 17 topics down into two separate categories: topics related to identity (e.g. gender inequality, racial inequality, affirmative action, abortion, transgender issues, sexual assault) and topics not related to gender and race (e.g. gun control, China, COVID vaccine mandates, mask mandates, free speech, etc.).
Figure 16 – Number of Identity and Non-Identity Topics that are Difficult to Discuss Openly and Honestly
As the graphs demonstrate, larger DEI bureaucracies are correlated with more difficulty having open and honest discussions on both identity-related (r=.31, p=.01) and non-identity-related issues (r=.41, p=.00).
The size of university DEI bureaucracies is highly correlated with student ideology and the racial and ethnic diversity of the student body (see above). This just means that the bivariate relationship between DEI and the number of speech topics might be spurious. Consistent with this possibility, Table 5 shows that the size of the DEI bureaucracy is no longer a significant predictor of student feelings about identity-related and non-identity-related topic discussions once we control for other likely influences on student feelings. So, once again, we must conclude that although DEI bureaucracies may or may not make “open and honest” conversations on college campuses harder, they almost certainly do not make them easier.
Table 5 - Number of Identity and Non-Identity Topics that are Difficult to Discuss Openly and Honestly
Conclusion: DEI and the “Free Speech Crisis”
There’s congealing conventional wisdom among critics of higher education that university DEI bureaucracies are “cancers that stifle free speech.” Yet, there have been no empirical studies to date testing these claims. Combining data from the Heritage Foundation and FIRE, this post shows that there is, in fact, some truth to these claims. Universities with more DEI personnel are only creating a more welcoming, accepting, and inclusive environment when the question is whether controversial liberal speakers should be allowed to speak on campus. On every other dimension of campus speech, larger DEI bureaucracies do not lead to better free speech climates. What’s more, along a number of other dimensions of campus speech (e.g. student comfort with expression outside of classrooms, support for disruptive action in response to offensive speech, the perceived difficulty of having “open and honest” conversations), universities with more DEI employees perform worse. In short, DEI bureaucracies commonly hurt and infrequently help free expression on college campuses. Whatever their benefits (and they may be considerable on other dimensions), DEI bureaucracies do not help speech climates.
These conclusions should be considered alongside three caveats. First, it is impossible with the data we currently have (i.e. snapshots of the DEI bureaucracy and attitudes towards free expression in 2022) to definitively conclude that the number of DEI personnel is leading to worsening campus speech climates and not the other way around. Indeed, one possible explanation consistent with the above data is that an oppressive DEI bureaucracy is making students less supportive of free speech. Another possibility, however, is that censorious students are successfully demanding larger and more intrusive DEI bureaucracies. While the latter explanation seems far less plausible than the former, we can’t, strictly speaking, rule it out with the existing data.
Second, the findings presented above only apply to the relatively small and deeply unrepresentative group of 71 universities studied here (a combination of Power 5 conference and Ivy League schools). If data on the number of DEI personnel was available for the more than 200 universities surveyed by FIRE, we might have arrived at a very different set of conclusions about how DEI shapes campus speech environments.4 Most notably, this analysis does not include the small, Northeastern liberal arts colleges that were initially responsible for elevating concerns about campus free speech beginning in 2015. Obviously, more work is needed to collect DEI information on the full set of American universities.
Finally, the findings discussed above only apply to a single moment in time (2022). Campus speech climates can change quickly. Student populations experience tremendous turnover across time, with the student body being replaced in its entirety every few years. What’s more, a single, high-profile controversy on a campus might dramatically alter how comfortable students feel expressing themselves. Similarly, DEI efforts may expand or contract in ways that communicate different things to different student cohorts about the boundaries of acceptable speech. All of this is just to say that the strength of the relationship between DEI bureaucracies and free speech environments is a variable, not a constant, and it should be periodically reexamined.
Thank you to John V. Kane (@UptonOrwell) for the tip sheet on making more visually appealing graphs (https://www.dropbox.com/s/s0udmvaou3t93vb/TIPS%20FOR%20MAKING%20NICE%20STATA%20GRAPHS.pdf?dl=0).
The index of discomfort expressing opinions outside of class included responses to three questions: (1) “How comfortable would you feel doing the following on your campus? Expressing your views on a controversial political topic to other students during a discussion in a common campus space such as a quad, dining hall, or lounge”; (2) “How comfortable would you feel doing the following on your campus? Expressing an unpopular opinion to your fellow students on a social media account tied to your name”; (3) “On your campus, how often have you felt that you could not express your opinion on a subject because of how students, a professor, or the administration would respond?”
Some might be concerned that the displayed regression line is incorrectly suggesting a relationship that does not exist given the presence of outliers in the data. Stanford, for example, is something of an outlier. Harvard and Duke might also be outliers. Dropping these three “outliers” does not change the results of the analysis in any way. In other words, the bivariate analysis shows the same relationship even with the exclusion of the outliers:
The small sample size may make the results sensitive to outliers and to model specification decisions. Once again, these results should be interpreted cautiously.












Good to see some quantitative analysis of the effects of DEI on campus climate. As far per the stated goals of DEI -- this is an Orwellian lie. If we analyze what they actually do in terms of concrete policies and activities, it becomes obvious that a more accurate operational definition of 'DEI' is Discrimination, Entitlement, and Intimidation. This should not come as a surprise of one considers the theoretical foundations on which this apparat operates -- postmodernism, critical theories, and ultimately plain old Marxism.
DEI bureaucracies are categorical enemies of humanism and liberalism. We must purge our universities from them:
https://hxstem.substack.com/p/fighting-the-good-fight-in-an-age
https://freeblackthought.substack.com/p/dei-colleagues-your-anti-semitism
Excellent article, thank you