Ideology and Intolerance at America's Elite Universities
America's future elites are more liberal, more "tolerant," and more supportive of disruptive action in response to offensive speech than the country that they will ultimately preside over.
There are endless (and breathless) analyses of the political opinions of Gen Z. While some claim Gen Z is “the most progressive” generation we’ve ever seen, others have argued that Gen Z “might not be as 'woke' as most think.” Regardless of how they describe the politics of Gen Z, nearly all of these analyses treat young people as an undifferentiated group. The assumption embedded in this treatment is that all members of Gen Z will be equally important in shaping the nation’s political, economic, and cultural future.
This, of course, is an absurd idea with very little empirical data to support it. For better or worse, American society is top-down and elite-driven, with a small number of people wielding a larger amount of influence through their positions in key social institutions. As discussed below, this relatively tiny group is often educated at a relatively tiny number of elite universities. If we want to understand how Gen Z will change American society, we need to look narrowly at the members of Gen Z that are enrolled in the nation’s most prestigious universities instead of looking at Gen Z more generally.
The findings presented below show that America’s elite universities are politically distinct from the country they will ultimately preside over. To be more exact, elite university students are far more liberal and far more Democratic than older Americans and their non-college attending, Gen Z counterparts. Furthermore, the analyses here show that there is a unique and somewhat contradictory pattern of thinking about political tolerance at America’s elite universities. Students attending Top 20 universities are significantly more likely than students from lower-ranked universities to say that they would allow both extreme liberal and extreme conservative speakers to deliver a speech on campus. Yet, elite university students’ greater willingness to allow controversial speech is tempered by the fact that they are far more willing than students attending non-elite schools to support shout-downs, blockades, and violence as a means of preventing an offensive speech from taking place. Elite university students are, in short, paradoxically less likely to express intolerance in the form of explicitly banning offensive speakers from campus and more likely to express intolerance in the form of supporting illiberal reactions designed to prevent speech they find offensive.
Over the course of describing the uniqueness of the country’s elite universities, we will also uncover a number of other important attitudinal characteristics of American college students. The analyses below show, for example, that fewer than 10% of women attending elite universities identify as liberal. Additionally, we will see that women are more likely to support de-platforming offensive speakers than men and “agender,” “genderqueer,” “non-binary” or “unsure” students are more likely to support disruptive action in response to speech than men or women. More generally, the analyses below show the groups that have historically benefitted most from robust norms emphasizing the value of free speech, political tolerance, and peaceful protest – progressives and members of national racial, gender, and sexual minority groups – are now the least supportive of them.
As the institutions of American life undergo rapid and dramatic compositional changes - becoming more liberal, more female, and more racially and ethnically diverse - and as political polarization intensifies partisan and ideological conflicts, the future of America’s distinctive brand of liberal democracy is unclear. This post hopes to provide some insight into the political values held by the group most likely to play a major role in this uncertain future: the country’s elite university students.
Why Elite Schools Matter?
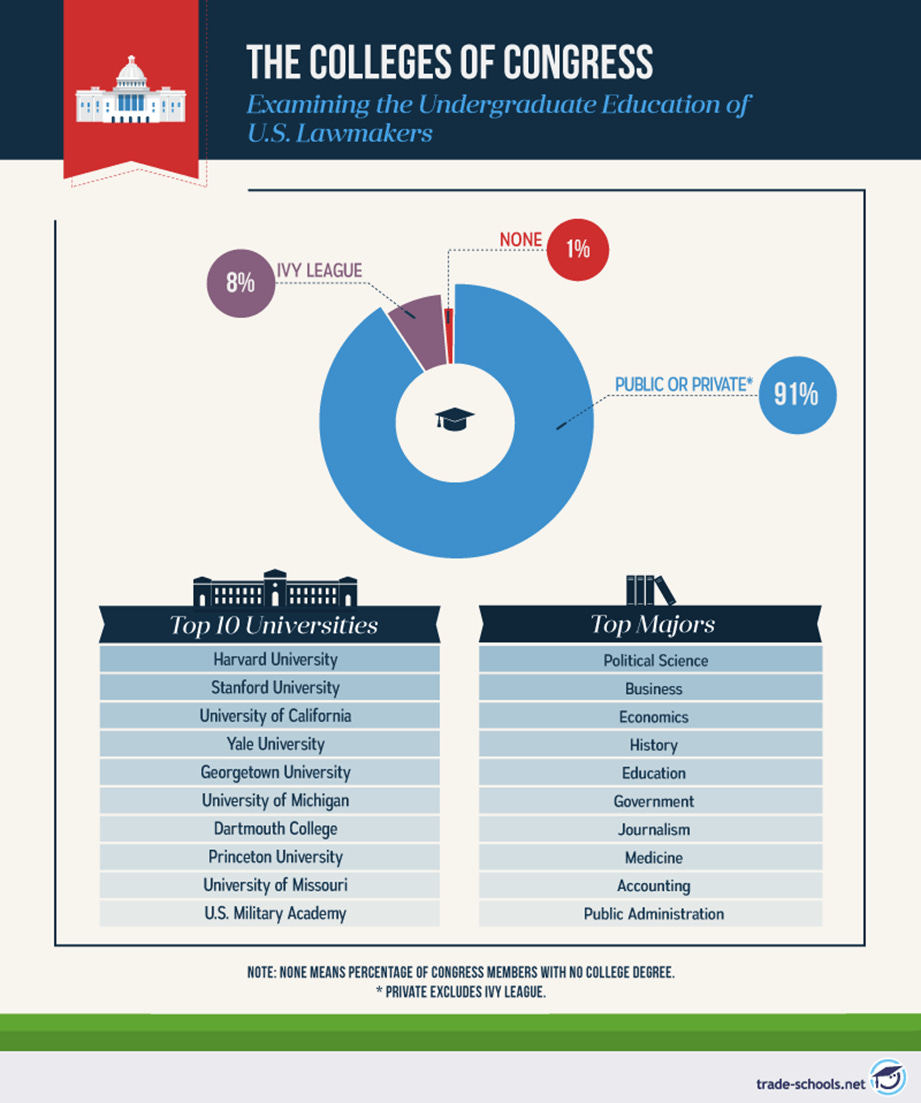
Understanding the politics of elite universities is important because elite universities produce a vastly disproportionate share of the elites that control the country’s central political, economic, legal, technological, and educational institutions. Consider, for example, the educational pedigree of elected officials. A 2020 study of Congress found that while only 0.4% of undergraduates attend one of the Ivy League schools, 8% of members of the House and the Senate were Ivy League alumni. Furthermore, all but two of the top 10 most attended universities by members of Congress were featured in the Top 20 of US News and World Report’s College Rankings (Figure 1).
Figure 1 - Educational Pedigree of US Lawmakers
What about political appointees? While data here is harder to track down, a 2014 National Journal survey of the 250 top decision-makers within the Obama administration found that 40% were Ivy League graduates (with more than 60 attending Harvard alone). In fact, more Obama administration officials had degrees from England’s Oxford University than from any American public university.
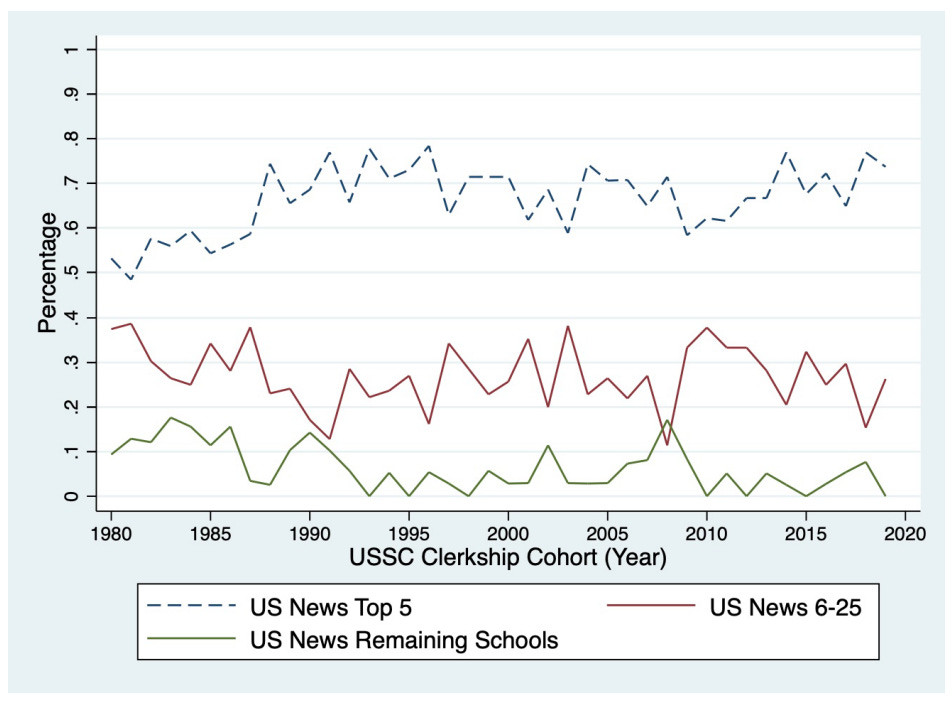
The same pattern emerges when looking at the federal court system. There are 204 American Bar Association-approved law schools in the United States. As Figure 2 shows, in the past four decades, more than two-thirds of all Supreme Court law clerks have graduated from one of five law schools: Harvard, Yale, Stanford, Columbia, and the University of Chicago, and 94% of the clerks have come from law schools ranked in the top 25 by U.S. News and World Report.
Figure 2 - Annual Composition of Law Schools from where Court Clerks Graduated (1980-2020)
It’s not just elite law schools that matter, however. A recent paper found that where a person received their undergraduate degree exerted a significant influence on whether they were ultimately selected to be a Supreme Court clerk (independent of where they received their law degree). For instance, those who graduated from one of 22 highly selective undergraduate institutions were more likely than undergraduates from less prestigious schools to be chosen as Supreme Court clerks (even among those who graduated from Harvard Law with honors).
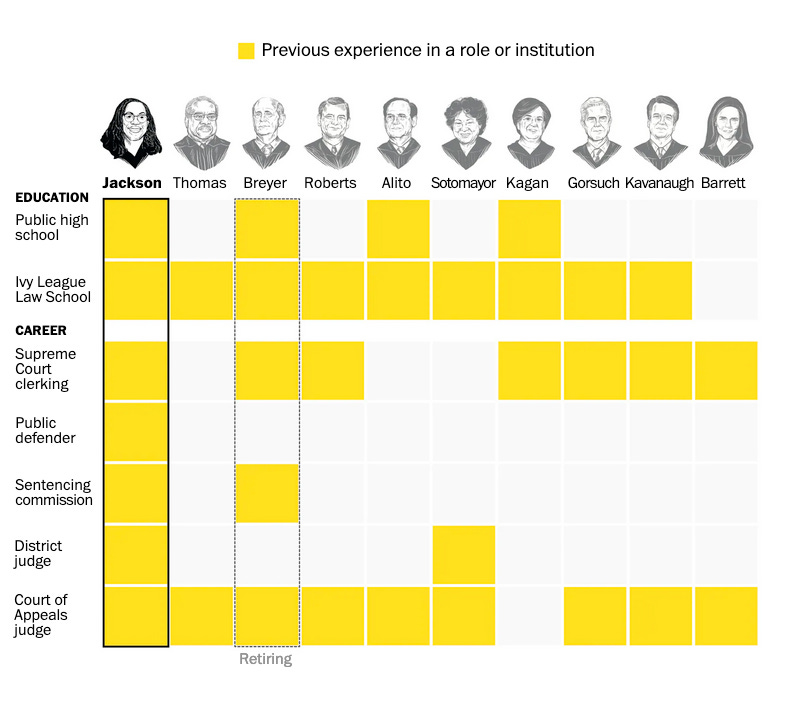
Figure3 - Educational Pedigree of Supreme Court Justices
The makeup of the Supreme Court provides even further evidence of the dominance of elite educational institutions in the federal judiciary. In 2017, “Every Supreme Court justice went to Harvard or Yale Law School.” Currently, eight of the nine current Supreme Court justices attended law school at Yale or Harvard (Figure 3).
Figure 4 - Educational Pedigree of American Business Leaders
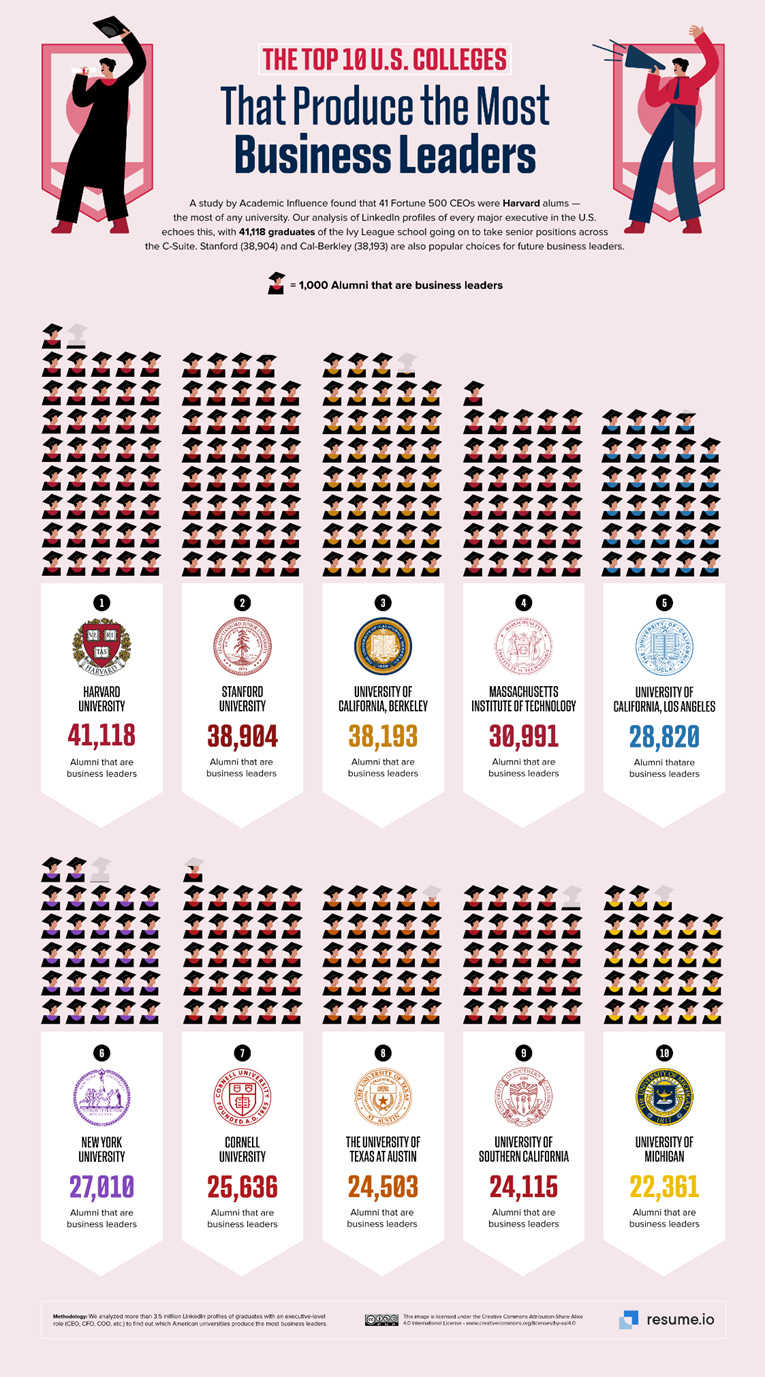
Unsurprisingly, business is no different than government when it comes to dependence on elite universities. In a study that looked for CEO in the job titles of more than 3.5 million LinkedIn profiles, Resume.io found that the most highly ranked universities in the country produce the most business leaders. As Figure 4 shows, nine of the ten universities that produce the most executives all land in the Top 25 of US News and World Report’s college rankings.
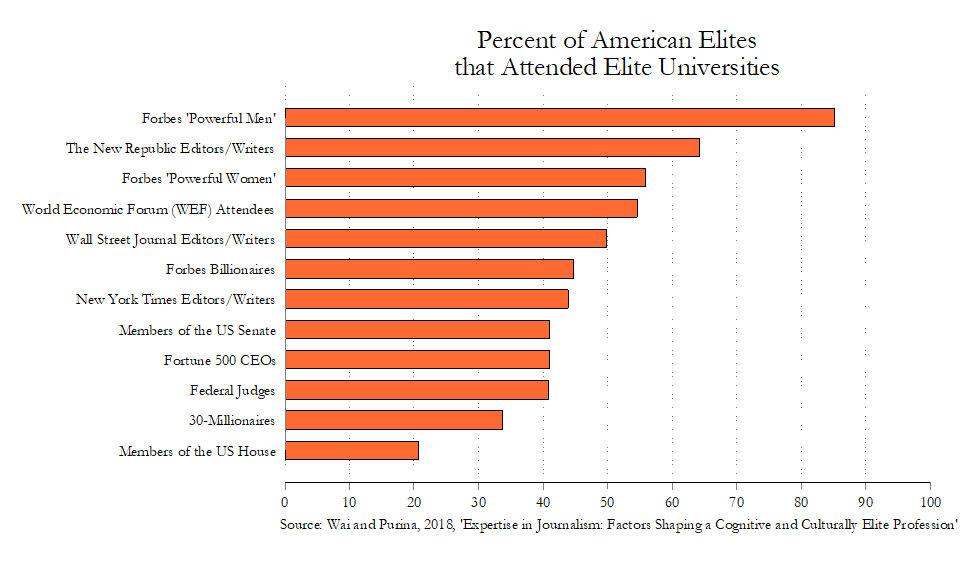
Overall, in a paper assessing the educational backgrounds of a wide variety of elite professions, Wai and Perina find that alumni from the 29 universities with the highest median combined SAT Math and Critical Reading scores and the 12 most highly ranked law and business schools were vastly overrepresented among leaders in business, government, the law, and journalism (Figure 5).
Figure 5 - Educational Pedigree of American Elites
We could go on and on and on like this. The main point is that a relatively small number of universities produce a vastly disproportionate share of our scientists, business leaders, lawyers, and policymakers. The values that students of these universities learn and practice during their time on campus inevitably seep into other major social institutions. If we are interested in the future of political tolerance and free speech, for instance, it is important to know not just what college students broadly think but also what students of elite universities believe.
A particular concern about elite universities today is that they have become more ideologically homogenous and less politically intolerant. To be more direct, elite universities are often criticized for their perceived hostility to right-leaning political figures, ideas, and speech. As Reihan Salam, for example, has pointed out that “many on the right see Ivy League universities and other similarly selective institutions as bastions of left-liberalism, where dissent from the right is tolerated only begrudgingly.” Similarly, Harvard law professors Jack Goldsmith and Adrian Vermeule have complained that “the distinctive progressive ideology of elite universities is relentlessly critical of, to the point of being intolerant of, traditions and moral values widely seen as legitimate in the outside world.” If this critique is accurate (i.e. elite universities are attracting and encouraging an unrepresentative and intolerant set of political views) and alumni of elite universities continue to dominate important social institutions, it could very well lead to a fundamental shift in the character of America’s liberal democratic order.
So, is there any basis for these criticisms? In the sections that follow, I use the Foundation for Individual Rights and Expression (FIRE) 2022 College Free Speech Rankings Survey data to identify what elite university students actually believe (and, importantly, whether it is different from what everyone else believes). More specifically, I answer three specific questions about America’s elite universities:
Are students at elite universities politically diverse?
Are students at elite universities politically intolerant?
Are students at elite universities supportive of disruptive action in response to constitutionally protected speech?
In order to answer these questions, I am going to examine the attitudes of those attending elite universities and compare them to the attitudes of those who attend non-elite universities. For the purposes of this analysis, I treated the top 20 schools in the US News and World Report rankings as “elite” while all other schools were treated as “non-elite.” The “elite” (or top 20) universities were: Princeton, MIT, Harvard, Stanford, Yale, University of Chicago, Johns Hopkins, University of Pennsylvania, Cal Tech, Duke, Northwestern, Dartmouth, Brown, Vanderbilt, Rice, Washington University, Cornell, Columbia, Notre Dame, Berkeley, and UCLA.
The decision to focus on the top 20 schools is, of course, fairly arbitrary and there are myriad problems with the US News and World Report rankings. The top 20 are responsible, however, for the vast majority of alumni identified in the graphics above.
Are students at elite universities politically diverse?
Measuring Political Beliefs
Every year since 2020, FIRE has conducted a nationwide survey of college students as part of their efforts to rank the free speech climates of American universities. The 2022 survey included 45,000 enrolled students at over 200 colleges around the country. In addition to questions about basic demographic characteristics (race, gender, sexual orientation, etc.), the FIRE surveys also asked respondents about their political views (i.e. their self-described political ideology and their partisan identification). When coupled with data about the university each student attends, it is possible to assess whether elite universities are more politically homogenous than non-elite universities.
The data from FIRE can also be compared against nationally representative surveys of the American public in order to assess whether college students generally or elite college students more specifically are similar to their non-college counterparts. While there are many potential surveys to use for this purpose, I will rely on the 2022 Cooperative Election Study (CES). The CES is useful for given my goals here because it has more than 5,000 Gen Z respondents and it poses questions about partisanship and ideology that are similar to those asked in the FIRE survey.
Eric Kaufman has used the FIRE data from 2020 and 2021 for a similar analysis. I highly recommend reading it for more discussion on these issues.
Partisanship and Ideology among All Americans
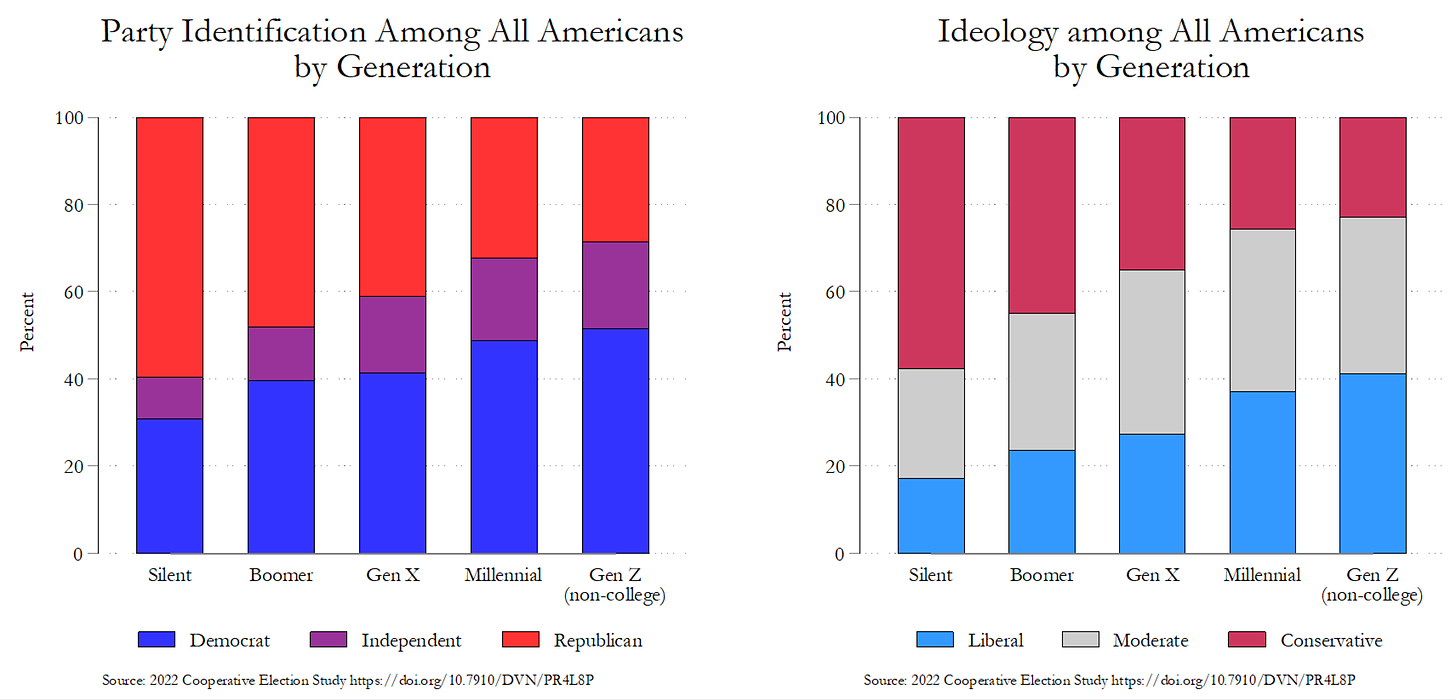
The left-hand panel of Figure 6 shows that Democrats have a major partisanship advantage (55.4% to 27.6%) among the young. The data for self-reported political ideology presented in the right-hand panel of Figure 6 tells a similar story. Young people are 20% more likely to identify as liberal than as conservative (43.2% to 22.2%).
Figure 6 - Partisanship and Ideology by Generations
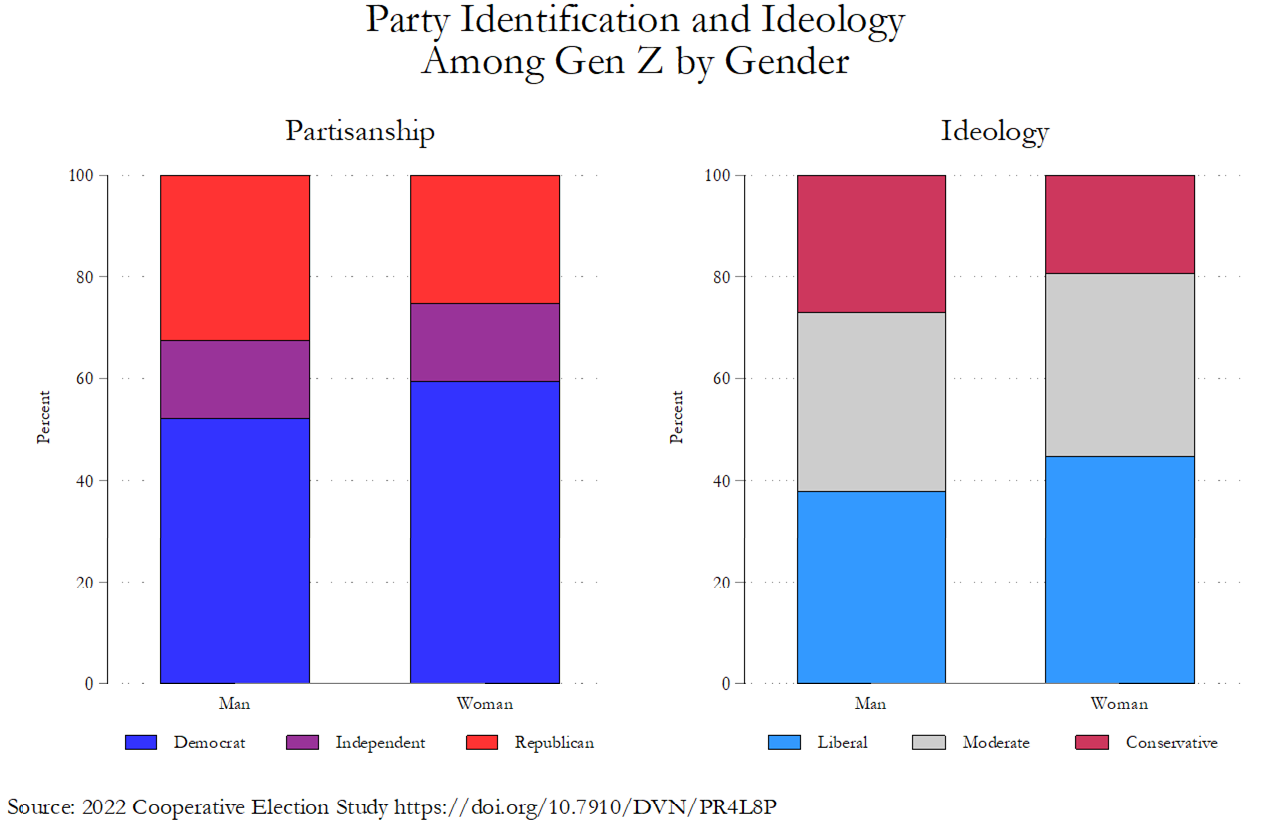
There is a small but statistically significant gender gap among young people, with women being significantly more Democratic and significantly more liberal than men. As Figure 7 shows, the partisan gender gap is approximately 7% for partisanship (with 52.1% of men and 59.4% of women identifying as Democrats) and approximately 7% for ideology (with 37.8% of men and 44.6% of women identifying as liberal).
Figure 7 - Partisanship and Ideology among Gen Z by Gender
Partisanship and Ideology among College Students
The gaps illustrated by Figures 6 and 7 are present but far more pronounced among college students than among other members of Gen Z. The advantage for Democrats and liberals is particularly prominent among students attending elite universities. As the left-hand panel of Figure 8 shows, Democrats outnumber Republicans by a factor of two to one (24.8% to 57.0%) at non-elite universities and by a factor of four to one (15.4% to 70.0%) at elite universities. As the right-hand panel of Figure 8 shows, there are 33% more liberals than conservatives at non-elite universities (57.7% to 24.7%) and 55% more liberals than conservatives at elite universities (71.9% to 16.4%).1
Figure 8 - Partisanship and Ideology among College Students
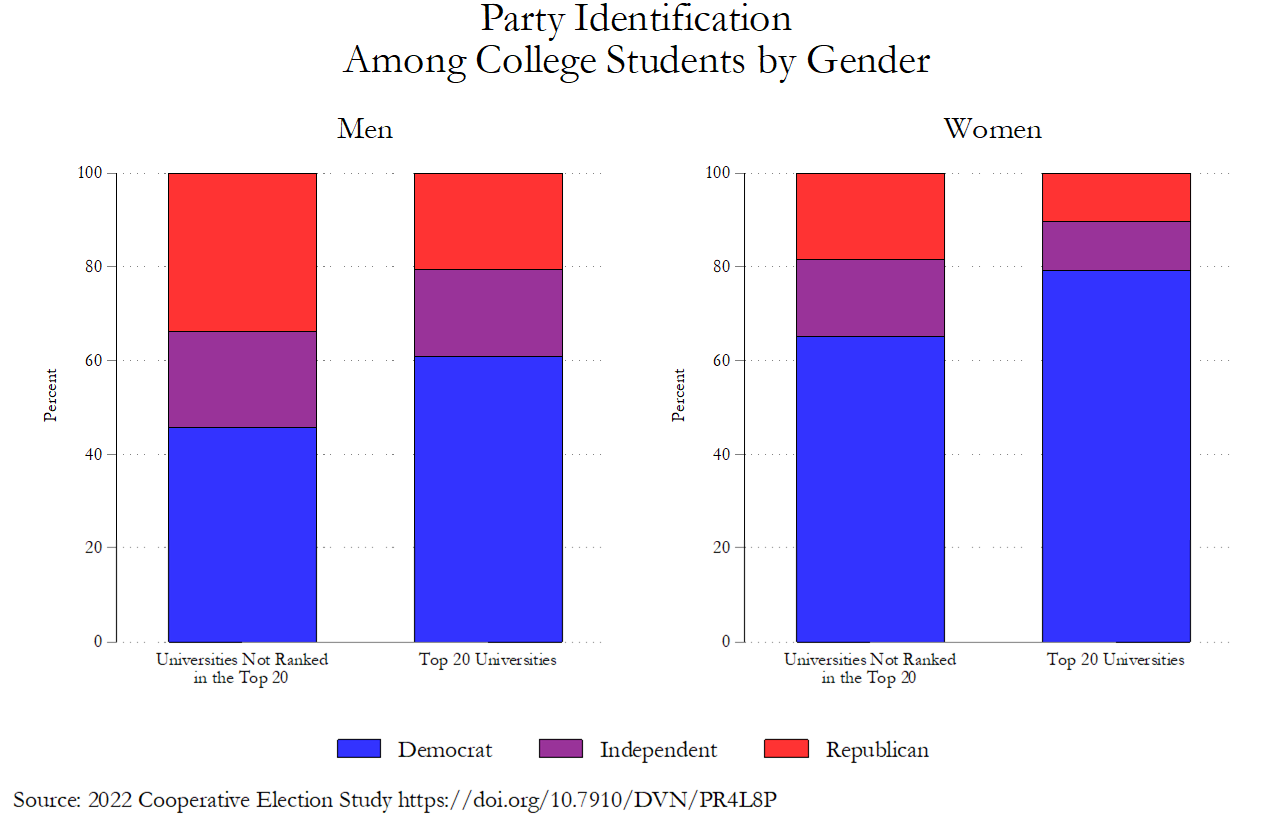
Figure 9 shows party identification among men and women at highly-ranked and lower-ranked universities. The most important thing to point out here is the massive size of the gender gap among college students. At both elite and non-elite universities, the gender gap is nearly 20%. As Figure 9 shows, 45.9% of men at non-elite universities identify as Democrats while 65.1% of women at non-elite universities identify as Democrats. Similarly, 60.9% of men at Top 20 schools identify as Democrats while a whopping 79.1% of women at Top 20 schools identify as Democrats.
Figure 9 - Partisanship among College Students by Gender
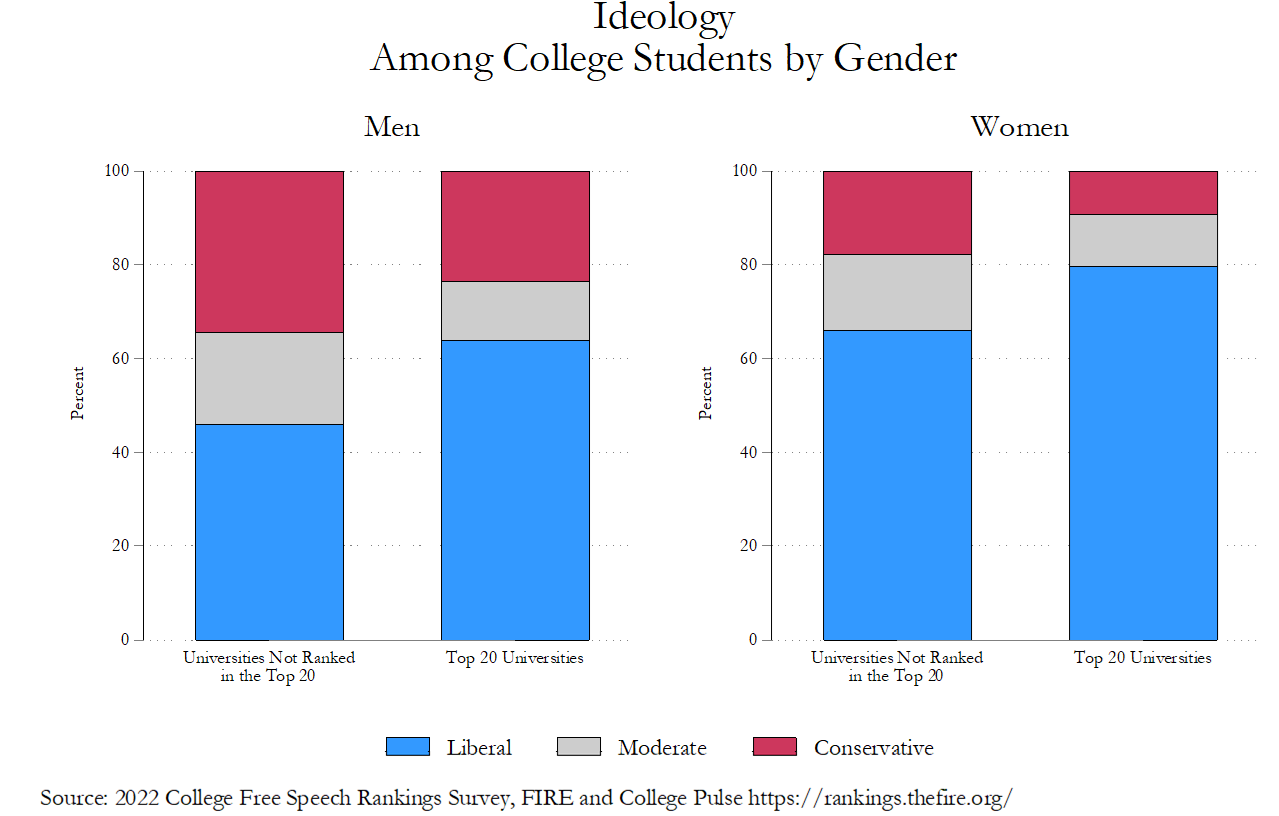
As Figure 10 shows, there is also a roughly 20% gender gap in ideology for college students (regardless of how prestigious their university is). Perhaps the most striking finding from Figure 10, however, is the fact that fewer than 10% of women at elite universities identify as conservative.
Figure 10 - Ideology among College Students by Gender
Overall - America’s Elite College Students are Politically Unrepresentative of Other College Students, Other Young People, and Other Americans
Collectively, these analyses allow us to draw three important conclusions about elite university students. First, students at elite universities are vastly different in their politics from members of Gen Z in the country more generally. For example, Top 20 university students are 15% more Democratic than other members of Gen Z. Similarly, while 43% of Gen Z are liberal, nearly 72% of those attending elite universities are liberal. The left-leaning and strongly Democratic politics of elite university students will likely mean that most of our important social, economic, political, and legal institutions will fail to adequately represent the country in the years to come. This lack of political representation has the potential to accelerate an already harrowing collapse of institutional trust and precipitate a foundational crisis in the legitimacy of foundational elements of American democracy.
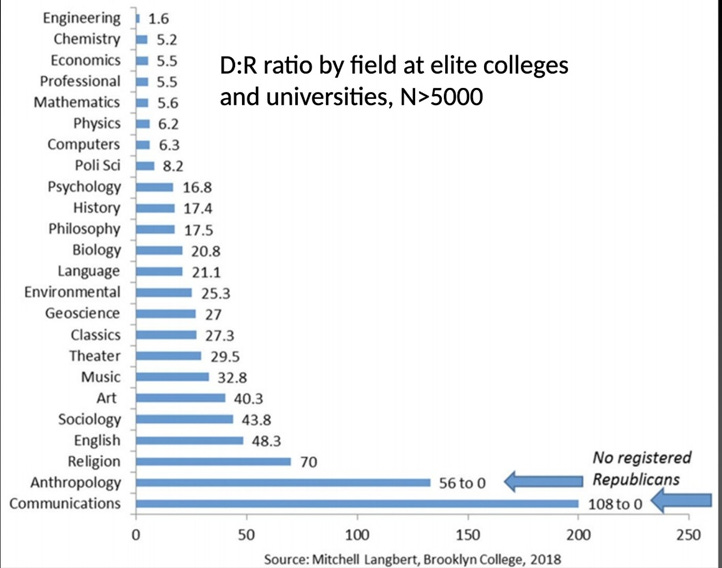
Second, although elite universities are not politically homogenous, they are certainly dominated by the political left. As discussed above, roughly two-thirds of elite university students identify as Democratic and liberal in their politics. This, of course, says nothing about the political homogeneity of the faculty. As Langbert, for example, found, the Democrat-to-Republican ratios at elite colleges and universities ranged from 1.6:1 in the field of engineering to 56:0 and 108:0 in communications and interdisciplinary studies (Figure 11).
Figure 11 - Partisan Identification of Faculty at Elite Universities
The dearth of Republican and conservative students and faculty at Top 20 universities is particularly striking in a country where Republicans frequently win control of the local, state, and federal government institutions. The fact that liberal, Democratic elite university students are unaccustomed to sharing institutional space with conservative Republicans may present serious governance challenges going forward.
Finally, the combination of the gender and educational gaps is creating a huge political divide - approximately 30-points in partisanship and ideology - between elite college-educated women and non-college educated men. This political divide may have ripple effects throughout other parts of American society. If Americans continue to remain reluctant to marry across partisan, ideological, and educational lines, for example, marriage rates may continue their precipitous decline. As Stone and Wilcox recently claimed in a widely circulated Atlantic Monthly piece (entitled “Now Political Polarization Comes for Marriage Prospects”), “fewer Americans are willing to date or marry across the aisle” and this is “bad news for marriage.”
The main point here, however, is that today’s elite college students are far more liberal and far more Democratic than previous generations and, more importantly, most other young people.
Are students at elite universities politically intolerant?
Measuring Intolerance of Controversial Speakers
In addition to the aforementioned questions about demographic characteristics and political identities, the FIRE survey also asked respondents a series of questions intended to assess how tolerant they are of controversial speakers. Specifically, students were asked whether the following five speakers espousing extreme liberal views should be allowed on campus:
The Second Amendment should be repealed so that guns can be confiscated.
Undocumented immigrants should be given the right to vote.
Getting rid of inequality is more important than protecting the so-called "right" to free speech.
White people are collectively responsible for structural racism and use it to protect their privilege.
Religious liberty is used as an excuse to discriminate against gays and lesbians
Students were also asked whether the following four speakers espousing views extreme conservative views should be allowed on campus:
Abortion should be completely illegal.
Transgender people have a mental disorder.
Black Lives Matter is a hate group.
The 2020 Presidential election was stolen.
FIRE’s question asked students to state their opinion on whether these speakers should be allowed on campus independent of whether they personally agreed with the speaker’s message (“Student groups often invite speakers to campus to express their views on a range of topics. Regardless of your own views on the topic, should your school ALLOW or NOT ALLOW a speaker on campus who promotes the following idea?”). In other words, the question was attempting to measure how principled students were with respect to speech on campus.
In the analyses below, I use two indices based on responses to these questions: (1) an index of intolerance for extreme liberal speakers; and (2) an index of intolerance for extreme conservative speakers. The scores of these indices range from 1 (meaning the respondent said every one of the hypothetical speakers should “definitely be allowed to speak”) to 4 (meaning the respondent said every one of the hypothetical speakers should “definitely not be allowed to speak”). By using this data, we can assess whether elite university students are more or less tolerant than students at non-elite universities.
Differences in Tolerance across Universities
In order to examine the political tolerance of elite university students, I first compared scores on the intolerance indices at “elite” and non-elite universities.
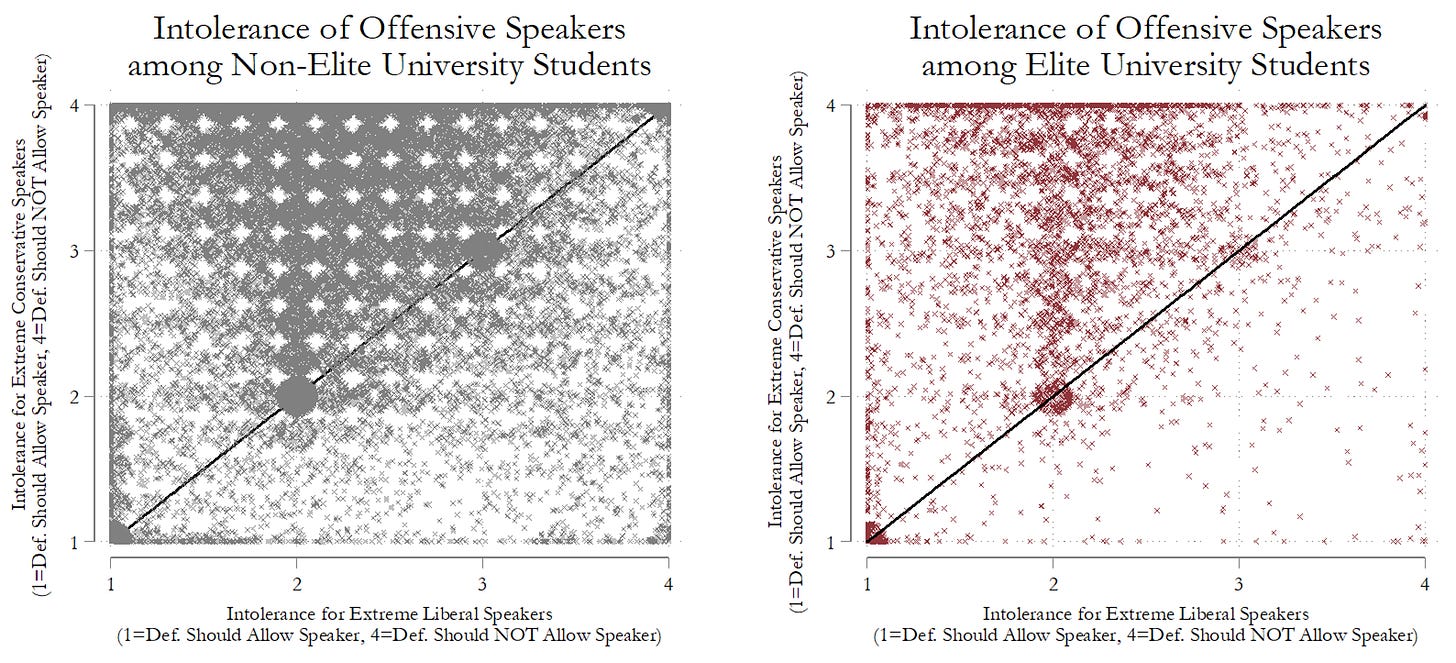
Figure 12 – Intolerance for Offensive Speakers at Non-Elite Universities
Figure 12 shows the mean intolerance for extreme liberal speakers (x-axis) and extreme conservative speakers (y-axis) for every respondent in the FIRE data (with each small “x” indicating an individual respondent). The dark black “line of equality” running at a 45-degree angle through the plot areas in Figure XXX indicates where a student would fall if he or she were equally intolerant of all speakers. Students positioned above the “line of equality” are more intolerant of extreme conservative speakers than intolerant of extreme liberal speakers. Students falling below the “line of equality” are more intolerant of extreme liberal speakers than intolerant of extreme conservative speakers.
As Figure 12 shows, there are relatively few “free speech absolutists” (i.e. students who say that all speakers should “definitely be allowed” to give a talk on campus) at American universities today. At the same time, however, there are also relatively few “consistent censors” (i.e. students who say that all speakers should “definitely not be allowed” to give a talk on campus) enrolled in the country’s universities. Most students tend to apply principles of political tolerance in a highly selective fashion.
As Figure 12 also shows, at both elite and non-elite universities, the areas under the “lines of equality” are sparsely populated (indicating there are very few students who are more intolerant of extreme liberal speakers than they are of extreme conservative speakers). In fact, only 8% of students at Top 20 and 14% of students at lower-ranked universities are more tolerant of conservative speakers than liberal speakers. By contrast, the area above the “line of equality” (particularly between 1.5 and 2.5 for extreme liberal speakers and 2.5 and 3.5 for extreme conservative speakers) is densely populated.
Another way of illustrating the relationship between university prestige and political tolerance is to aggregate responses within each university. As Figure 13 shows, there is only one university in the country – Hillsdale College – where students are more intolerant of speakers offensive to conservatives. Every other university in the country is more tolerant of speakers offensive to conservatives than speakers offensive to liberals. As Figure 6 also shows, the differences in tolerance for speakers offensive to conservatives and those offensive to liberals are usually quite large. Among the Top 20 universities, the University of Chicago stands out as being the most tolerant.
Figure 13 – Indices of Intolerance for Offensive Speakers
In order to best describe the role that attendance at elite universities plays in shaping political tolerance, I estimated an OLS regression model that predicts intolerance to extreme liberal and extreme conservative speakers on the basis of an individual’s gender identity, sexual orientation, race, and political ideology as well as each of these variable’s interaction with university ranking. In the figures below, I present the predicted “intolerance scores” associated with these various attributes after controlling for all of the other variables in the model.2 In other words, the graphs presented below depict the unique influence of the characteristic identified in the graph on a student’s “intolerance score” once the influence of other factors has been separated out.
Figure 14 – Indices of Intolerance for Offensive Speakers
Figure 14 shows the predicted “intolerance score” for elite and non-elite university students after controlling for all other influences. As Figure XXX further underscores, students are, on average, far more intolerant of speakers that communicate controversial conservative viewpoints (e.g. “Transgender people have a mental disorder,” “Black Lives Matter is a hate group,” etc.) than they are of speakers who communicate controversial liberal viewpoints (e.g. “White people are collectively responsible for structural racism and use it to protect their privilege,” “Religious liberty is used as an excuse to discriminate against gays and lesbians”).
More importantly, Figure 14 shows that attending an elite university instead of a lower-ranked university is associated with lower intolerance scores for both extreme conservative and extreme liberal speakers. The difference in intolerance scores between students attending Top-20 universities and students attending lower-ranked universities is particularly large for extreme liberal speakers.
It is possible that the higher levels of tolerance associated with attendance at a Top-20 school are a consequence of higher levels of tolerance only among certain subgroups within these universities. For example, it might be the case that elite universities make or attract women who are more politically tolerant than those attending non-elite universities but they actually make or attract men who are far less politically tolerant than those attending non-elite universities. Alternatively, it might be that more tolerant whites are selected for by elite schools but there are no differences in the kinds of non-whites admitted to elite schools. As we will see, what is so striking about the impact of attendance at elite universities is that it is associated with more tolerance among every major subgroup on campus.
Differences in Tolerance across Gender Identities
Gender identity is an important influence on political tolerance. As Figure 15 shows, after controlling for all other factors, men are significantly more tolerant than women and those who identify as other genders (e.g. “Agender,” “Genderqueer,” and “Non-Binary”). Interestingly, those identifying as “other” genders are also significantly more tolerant than women. Put differently, women are more intolerant of both extreme conservative and extreme liberal speakers than any other gender group (independent of race, sexual orientation, and political ideology).
Figure 15 - Intolerance by Gender and University
Attendance at an elite university is associated with less intolerance across all gender identities. As Figure 15 shows, students of all genders at elite universities are significantly less intolerant than their counterparts at non-elite universities. For example, men at Top 20 universities are more tolerant of extreme liberal speakers (mean intolerance = 1.8) than men at lower-ranked universities (mean intolerance =2.1). The same can be said of the mean intolerance levels of women (2.3 to 2.0) and “other” gender identity students (3.0 to 2.8). A similar pattern of intolerance exists with respect to extreme conservative speakers. Regardless of gender identity, in other words, students at elite universities are more tolerant than those at non-elite universities.
Differences in Tolerance across Sexual Orientations
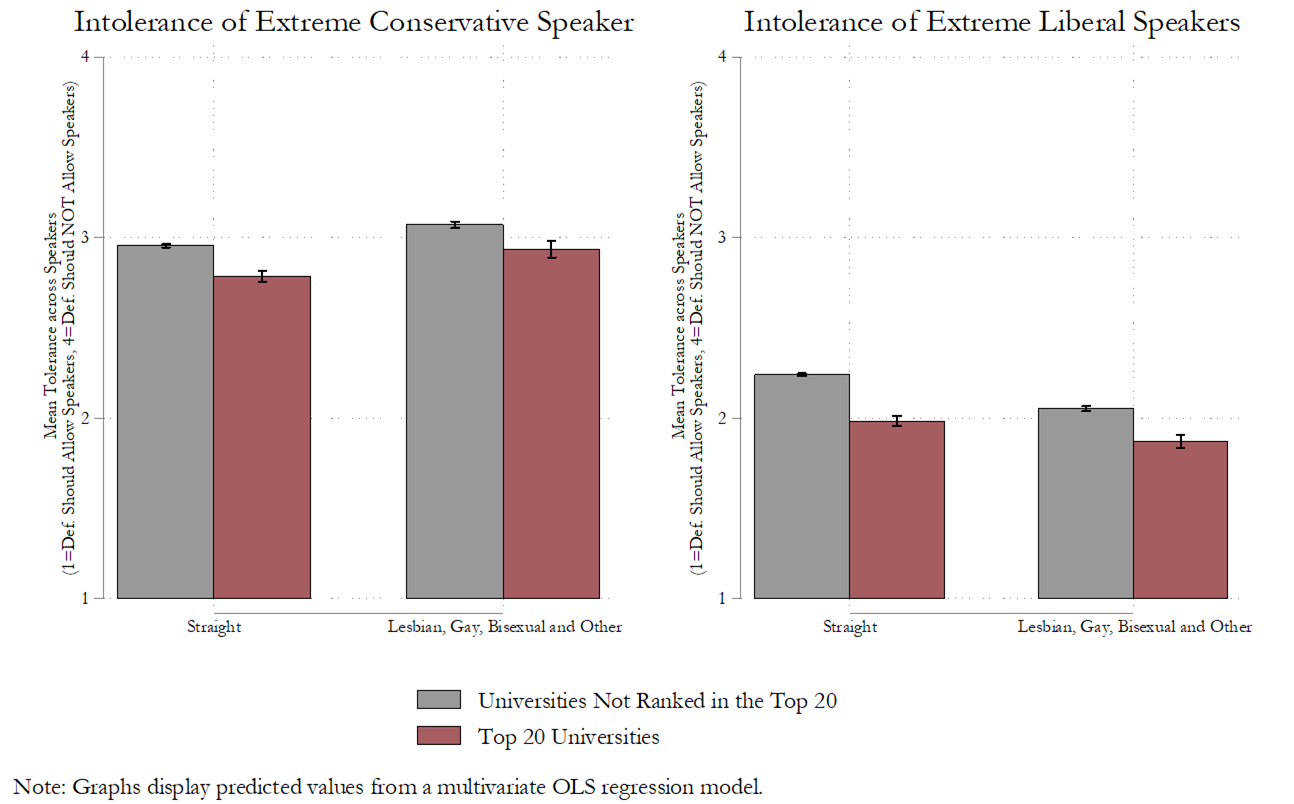
Receiving an elite university education is also correlated with less intolerance across all sexual orientations. As Figure 16 shows, attendance at a Top-20 university is associated with significant decreases in intolerance among straight students and among lesbian, gay, bisexual, and students with “other” sexual orientations. Once again, the effect exists for both extreme liberal and extreme conservative students.
Figure 16 - Intolerance by Sexual Orientation and University
It is also important to point out here that straight students (regardless of the kind of university they attend) are more tolerant of extreme conservative students than lesbian, gay, bisexual, and “other” sexual orientation students. By contrast, lesbian, gay, bisexual, and “other” sexual orientation students (regardless of university prestige) are more intolerant of extreme conservative speakers. As a reminder, these differences are not a function of confounding with gender, race, or political ideology. Straight students are more tolerant of conservatives while non-straight students are more tolerant of liberals.
Differences in Tolerance across Race
Racial differences in tolerance are generally less pronounced than differences based on gender and sexual orientation. As Figure 17 shows, however, there is still an important effect on tolerance scores associated with attendance at an elite university among all racial groups. With the lone exception of African American students and tolerance for extreme conservative speakers, attending a Top-20 school is predicted to significantly decrease intolerance among students of every racial group for both conservative and liberal speakers.
Figure 17 - Intolerance by Race and University
Differences in Tolerance across Political Ideologies
Previous research has shown that political ideology is one of the largest influences on political tolerance. Typically, people are less willing to censor or punish speakers from their specific side of the political spectrum.
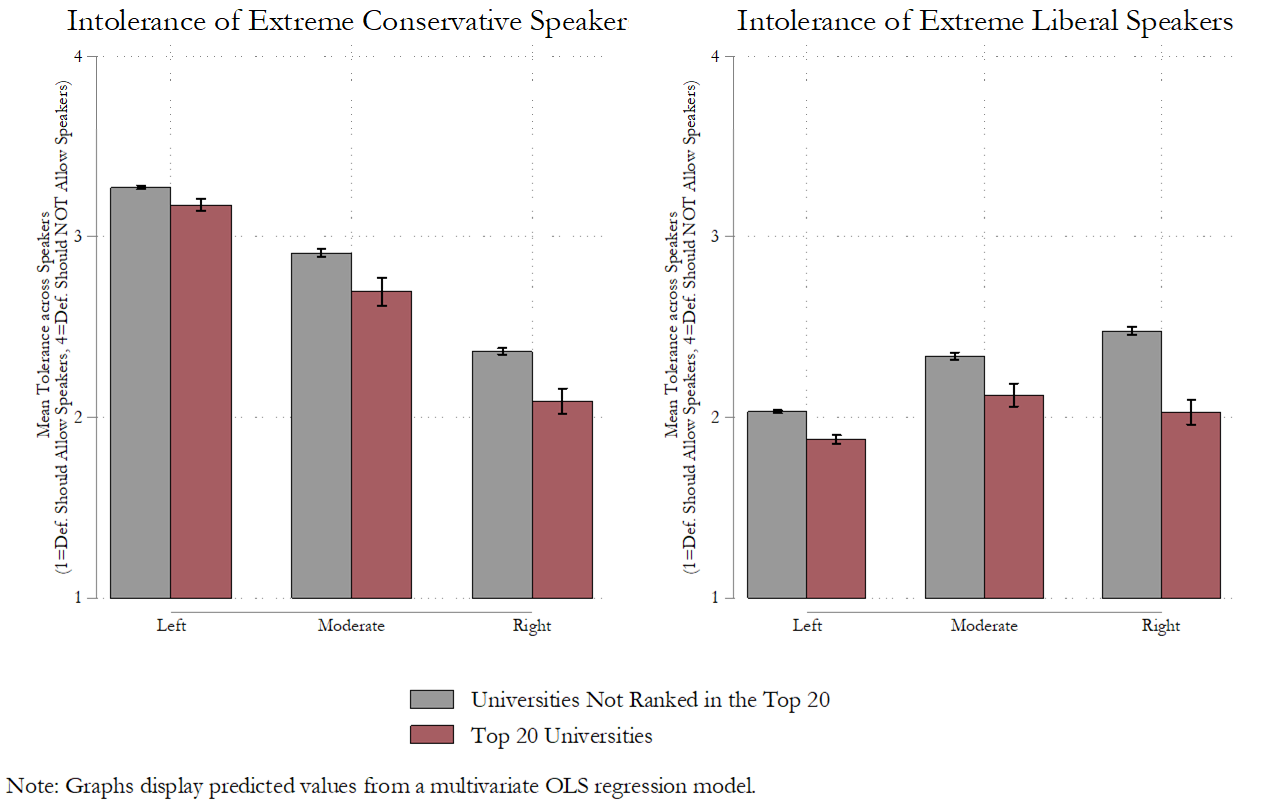
Figure 18 - Intolerance by Political Ideology and University
As Figure 18 shows, this is certainly true of students on the political left.3 Whether they attend Top-20 or lower-ranked universities, left-leaning students are far more intolerant of conservative speakers than of liberal speakers.
What is most surprising about Figure 18, however, is that right-leaning students at elite universities do not seem to discriminate based on ideology. For conservatives and libertarians at Top-20 schools there are no differences in predicted tolerance scores between extreme conservative speakers (tolerance score = 2.1) and extreme liberal speakers (tolerance score = 2.0). The same cannot be said of right-leaning students at lower-ranked universities. Much like left-leaning students, these students are more tolerant of those from their side of the political spectrum.
Figure 18 also illustrates the general pattern discussed above; namely, that attendance at an elite school reduces intolerance scores among all subgroups. Those on the left, those on the right, and those in the middle who are enrolled at a Top-20 university are less intolerant than their counterparts at lower-ranked universities.
Are students at elite universities supportive of disruptive action in response to constitutionally protected speech?
Measuring Support for Disruptive Conduct
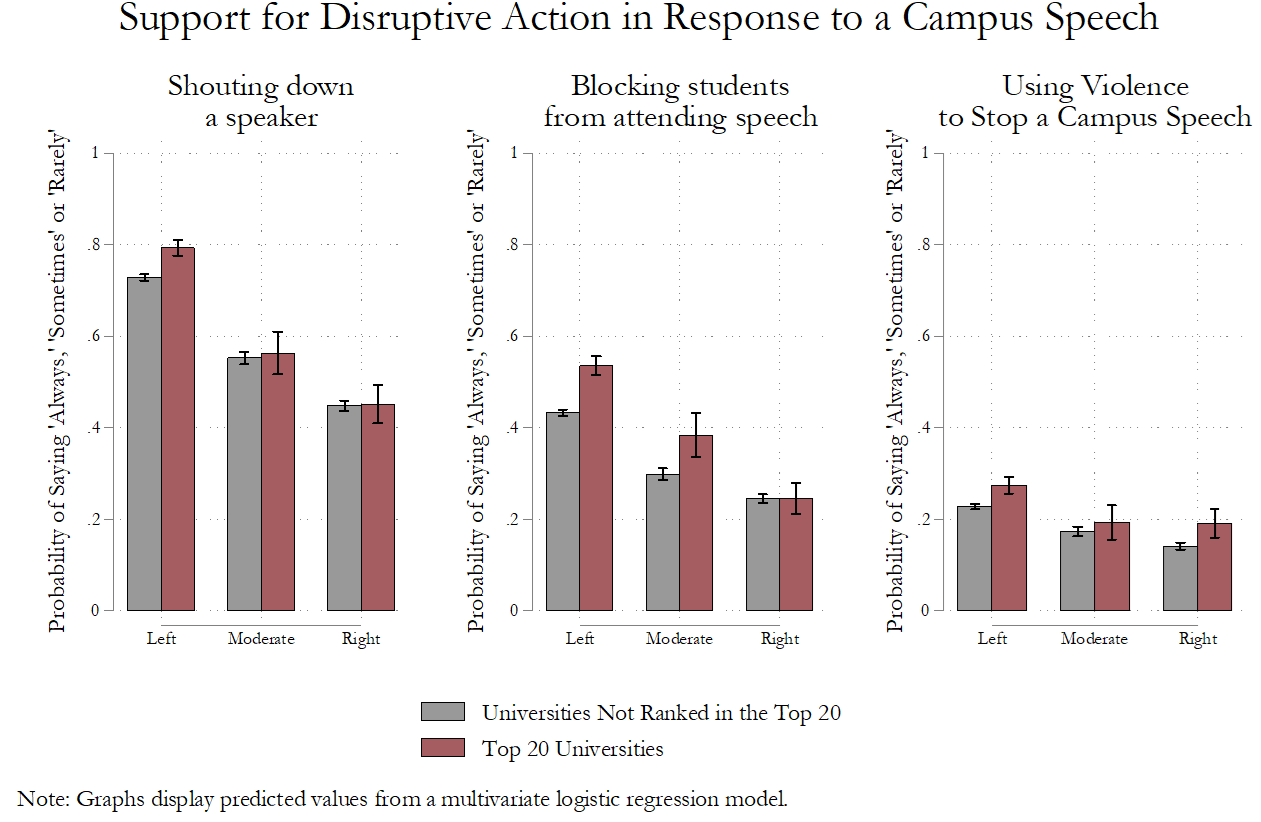
The FIRE survey also asked respondents “How acceptable [always, sometimes, rarely, never] would you say it is for students to engage in the following action to protest a campus speaker?”:
Shouting down a speaker to prevent them from speaking on campus.
Blocking other students from attending a campus speech.
Using violence to stop a campus speech.
These questions provide a useful proxy for measuring how strongly students subscribe to norms of political tolerance in response to offensive (yet constitutionally protected) speech.
Differences in Support for Disruption across Universities
As Figure 19 shows, support for free speech norms varies significantly between elite and non-elite universities.
Figure 19 – Acceptability of Disruptive Conduct in Elite and Non-Elite Universities (Overall)
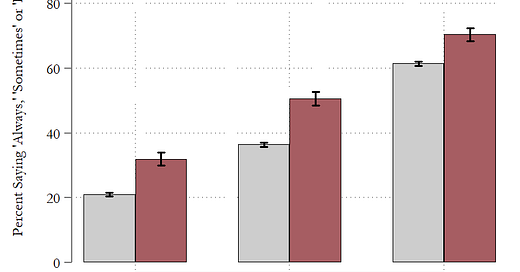
There is a 9% to 15% difference in support for each of the disruptive actions measured in the FIRE data between elite and non-elite universities, with students at elite schools significantly more supportive of violence, blockades, and shout-downs.
In this section, I rely on a multivariate logistic regression analysis to predict the probability that a student will view shout-downs, blockades, and violence as “always,” “sometimes,” or “rarely” acceptable. As in the previous section, this analysis includes measures of gender identity, sexual orientation, race, political ideology, and school ranking.
Once again, the differences between elite and non-elite universities illustrated in Figure 19 hold across almost every demographic group. Below, I show how minority groups are more supportive of disruption overall and, importantly, more supportive in elite universities.
Differences in Support for Disruption across Gender Identities
Let’s first consider the differences in support for disruptive action in response to offensive campus speech based on self-reported gender identity. Figure 1 compares the percentage of male, female, and “other” gendered students (“agender,” “genderqueer,” “non-binary” and students who were unsure about their gender identity) who say that shout-downs, blockades, and violence are “always,” “sometimes,” or “rarely” acceptable.
Figure 20 – Acceptability of Disruptive Conduct in Elite and Non-Elite Universities (Gender)
As Figure 20suggests, there is widespread support for disruptive action in response to an offensive campus speech among “other” gender-identifying students. After controlling for race, sexual orientation, political ideology, and university ranking, the predicted probability that an “agender,” “genderqueer,” “non-binary” or “unsure” student will endorse shout-downs is 70.7%. The predicted probability that an “other” gender student will endorse blockades is 52.2%. The predicted probability they will endorse “using violence” is 37.1%. By contrast, the predicted probabilities of supporting these actions among men is 61.4%, 36.1%, and 21.8%, respectively.
Figure 20 also shows the differences between students at elite and non-elite universities. Men at elite universities are significantly more likely to endorse blockades and violence than men at non-elite universities. Female and “other” gender-identifying students at Top 20 schools are far more supportive of every disruptive action than their counterparts at lower-ranked universities. For example, while there is a 45.9% predicted probability of a woman at Top 20 university saying a blockade is acceptable, there’s only a 36.7% chance of a woman at a non-Top 20 university endorsing blockades. In other words, the nation’s most highly ranked universities have student populations that, regardless of gender, are far more supportive of disruptive action than the nation’s other universities.
Differences in Support for Disruption across Sexual Orientations
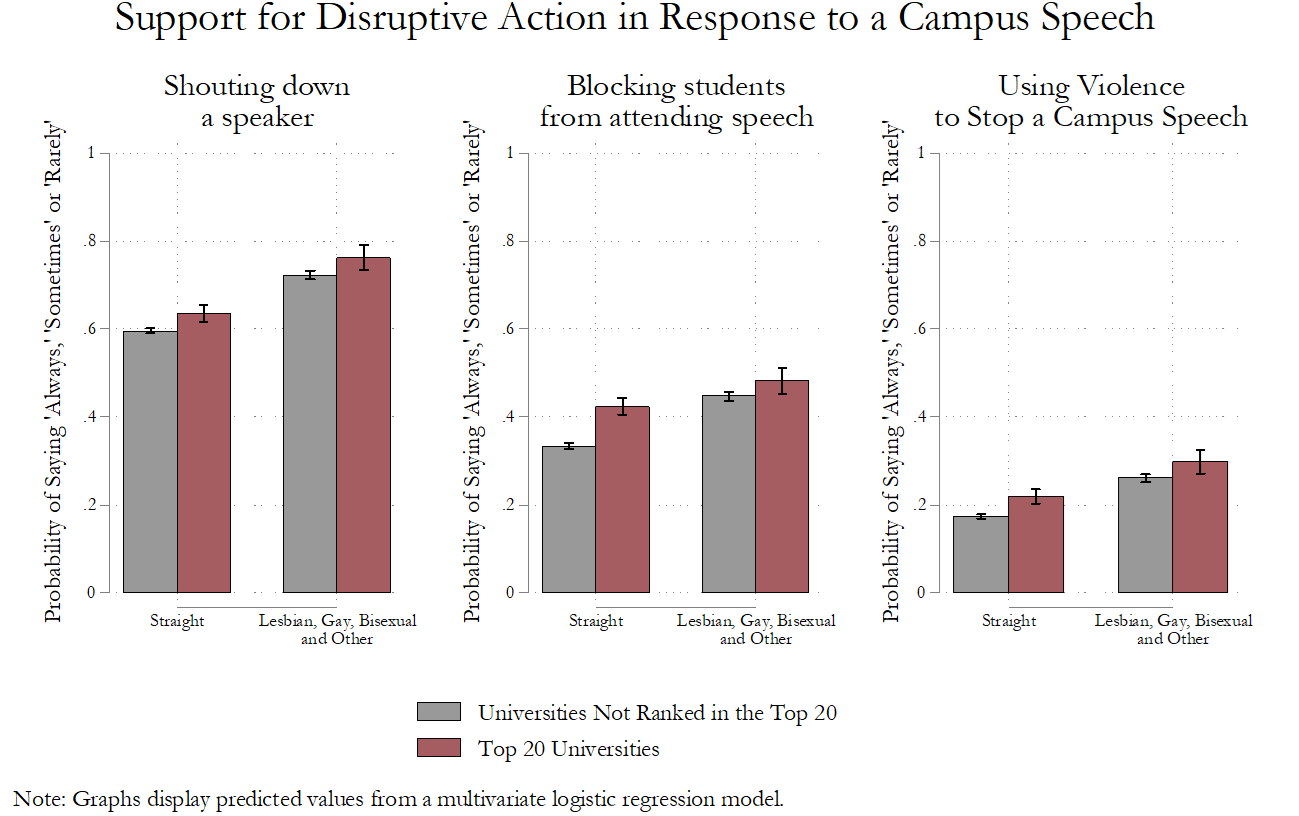
Across all universities, there are significant differences based on sexual orientation, with students identifying as lesbian, gay, bisexual, or “other,” expressing far more support for disruption than students identifying as heterosexual. To be exact, lesbian, gay, bisexual, and “other” students were 14% more likely to support violence (31% to 17%), 19% more likely to support blockades (51% to 32%), and 21% more likely to support shout-downs (78% to 57%) than straight students.
Figure 21 – Acceptability of Disruptive Conduct in Elite and Non-Elite Universities (Sexual Orientation)
Once again, these overall differences mask significant variation based on the kind of university a student attends. Regardless of sexual orientation, students at Top 20 universities are far more supportive of disruptive action in response to a campus speaker than students are lower ranked universities (Figure 3). As indicated in Figure 3, straight students at elite schools are significantly more likely to endorse shout-downs, blockades, and violence than straight students at non-elite universities. Gay, lesbian, bisexual, and “other” sexual orientation students at Top 20 schools were also more accepting of disruption than similar students attending schools outside of the Top 20.
Differences in Support for Disruption across Race
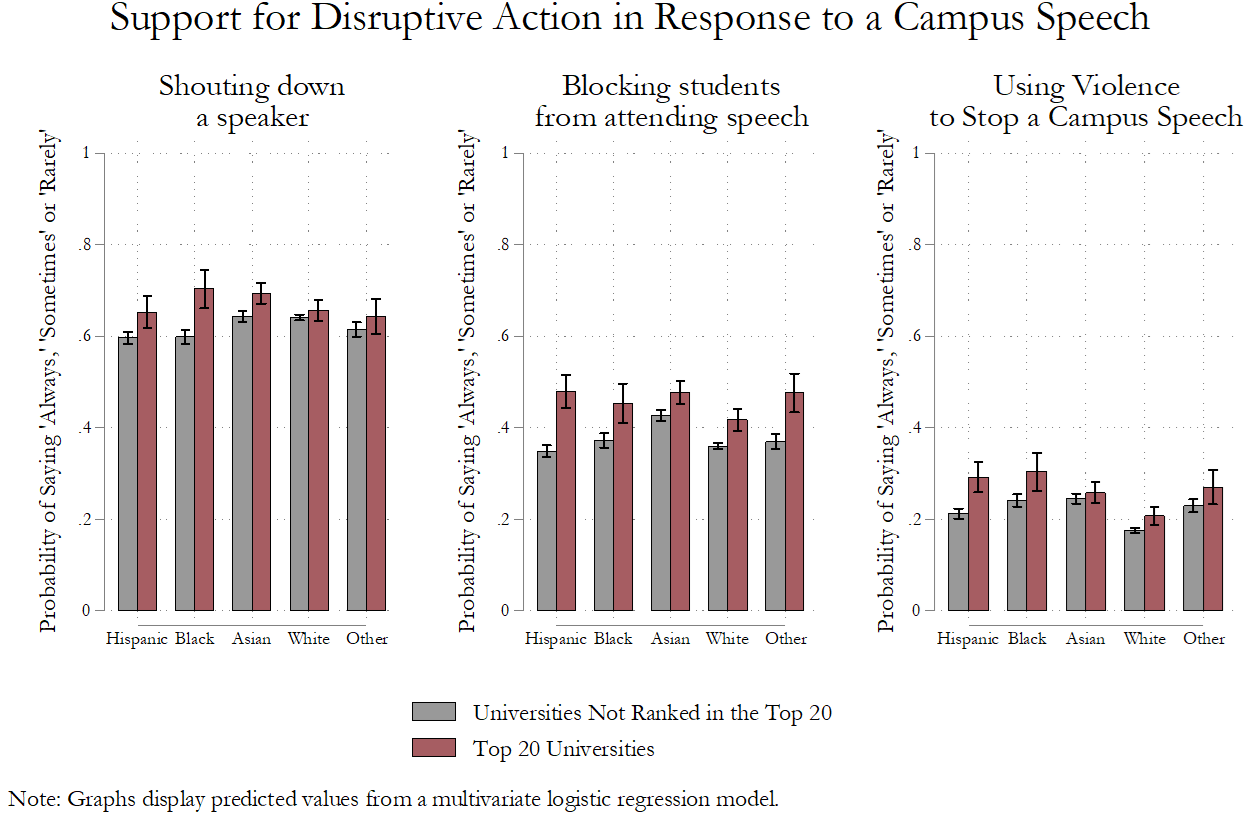
In the overall student population, differences in support for disruption based on race are somewhat smaller than differences based on gender identity or sexual orientation.
Figure 22 – Acceptability of Disruptive Conduct in Elite and Non-Elite Universities (Race)
There are no meaningful differences in how students of different races view “shouting down a speaker to prevent them from speaking on campus.” There are, however, large differences in perceptions of the acceptability of blockades and violence. As Figure 22 shows, non-white students are consistently more supportive of blockades and violence in response to offensive campus speakers. Notably, Asian (25.7%), Hispanic (25.1%), Black (24.3%), and students reporting “other” racial identities (26.9%), were all significantly more likely than white students (17.1%) to say that violence is “always,” “sometimes” or “rarely” acceptable.
As Figure 22 shows, elite university students are again more supportive of disruption than non-elite university students who share their race (with the one small exception of Asian American students on the question of using violence). Particularly striking are the differences between Hispanics at elite and non-elite universities. Hispanics at Top 20 universities were 21% more likely to support blockades and 17% more likely to support violence than Hispanics at lower-ranked universities.
Differences in Support for Disruption across Political Ideology
Ideology also appears to play a role in shaping how students view violent responses to campus speech. Left-leaning students (i.e. those identifying as “Democratic Socialists” and “Liberals”) are more accepting of “using violence” than moderate and right-leaning students (i.e. those identifying as “Conservative” and “Libertarian”) independent of the kind of university they attend.
Figure 23 – Acceptability of Disruptive Conduct in Elite and Non-Elite Universities (Political Ideology)
As Figure 23 shows, however, Top 20 university students are frequently more supportive of disruption than their counterparts at lower-ranked universities.
Overall - America’s Elite College Students are More Supportive of Disruption than Their Counterparts at Non-Elite Universities
The above analyses paint a complex picture of political tolerance at American universities. We might expect that the two sets of measures included in the FIRE surveys (one about allowing a speaker on campus and the other about supporting disruptive action) produce similar results about political tolerance across different kinds of universities. More directly, we should find that students that believe a speaker should be allowed to speak on campus should also reject disruptive action in response to that speech. This is not, however, what the FIRE data show. Students at elite universities are both more tolerant of offensive speakers and more supportive of disruptive action in response to speech than students at non-elite universities.
It is tempting to attribute these differences to the persuasive effects of faculty. It is important to point out here, however, that students - at both elite and non-elite universities - are actually far more intolerant of offensive speakers and far more supportive of disruptive action than faculty. In addition to their 2022 student survey, FIRE also conducted a survey of faculty members at public and private four-year degree-granting universities in the United States. While the faculty survey does not have a sufficiently large sample (N=1,491) to compare faculty at Top 20 universities to faculty at other universities, it does allow us to compare faculty responses on the FIRE tolerance and disruption questions overall to student responses.
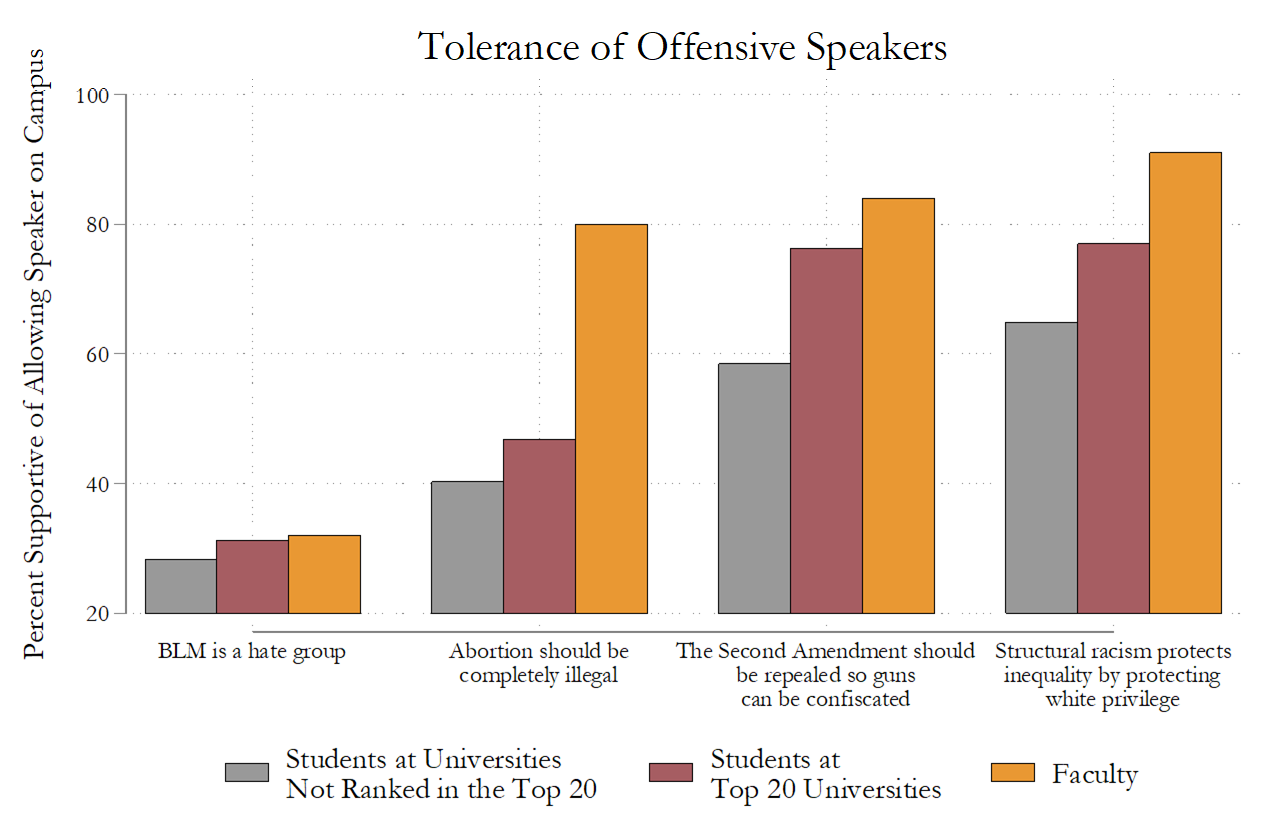
Figure 24 - Tolerance of Offensive Speakers among Students and Faculty
Figure 24 shows the faculty, elite university, and non-elite university comparisons for four of the political tolerance questions.4 As Figure 24 shows, students at elite universities were more tolerant than students at non-elite universities and faculty were more tolerant than students of all four hypothetical speakers. Support among students and faculty was highest for a speaker espousing the view that “structural racism maintains inequality by protecting White privilege.” Support among students and faculty was lowest for a speaker suggesting that “Black Lives Matter is a hate group.” The main idea here, however, is that faculty are much more tolerant than students.
Figure 25 - Support for Disruptive Action among Students and Faculty
Figure 25 shows the faculty, elite university, and non-elite university comparisons for the questions on disruptive action. Compared to students at both elite and non-elite universities, faculty were significantly less accepting of de-platforming speakers using illiberal tactics. What jumps out from Figure 25 the most, however, is the massive gulf between faculty and students at elite universities. Students at elite universities were 15% less likely than faculty to say shout-downs are “never acceptable,” 31% less likely than faculty to say that blockades are “never acceptable,” and 24% less likely to say that “using violence” is “never acceptable.”
Magnets or Mints?
What can explain the fact that elite university students are more liberal, more tolerant, and more disruptive than their peers and the rest of American society? Although the question of whether elite universities are “magnets” (i.e. places that attract more liberal, more tolerant, and more disruptive individuals) or “mints” (i.e. places that create more liberal, more tolerant, and more disruptive individuals) is one of the most interesting and politically salient features of debates about higher education, it cannot be easily answered with the existing data. In particular, the analysis here (showing significant ideological and political tolerance differences across different kinds of universities) should not be used to imply a “brainwashing” (or, less pejoratively, a “socialization”) effect among elite university students.
Nevertheless, it is worth saying a few words about these two approaches (“magnets” or “mints”) to explaining the cross-university differences in ideology and tolerance described above. The “magnet” idea suggests that elite universities simply recruit, attract and enroll more liberal, tolerant, and disruptive students. To take just one example of this broader class of explanation, elite university students might display more tolerance for offensive speakers because they are, on average, more intelligent (and more intelligent people tend to be more tolerant). According to one recent study, for instance, “Cognitive ability was the single strongest predictor of political tolerance, with larger effects than education, openness to experience, ideology, and threat.” Far more work on this particular relationship is needed but it does illustrate the idea that elite universities might be magnets (i.e. places that attract more liberal, more tolerant, and more disruptive individuals) rather than mints (i.e. places that create more liberal, more tolerant, and more disruptive individuals)?
Alternatively, elite universities might be “minting” students that are more liberal, tolerant, and disruptive (or non-elite universities might be “minting” students that are less liberal, tolerant, and disruptive). The idea here is that something about the university environments (e.g. the curriculum, the political views expressed by faculty, the interactions between students, the incentives created by university administrators) transforms students during their four years at college. Faculty attempts to explicitly propagandize their students and DEI efforts aimed at curtailing “hate speech” have been the two most commonly cited concerns along these lines but there are many other flavors of this argument.
Independent of whether the disparity between elite and non-elite universities is closer to the “magnet” or “mint” model, however, the disparity remains. If our institutions continue to disproportionately represent elite university alumni, our institutions will become more liberal, more tolerant, and more supportive of disruptive action as a response to offensive speech.
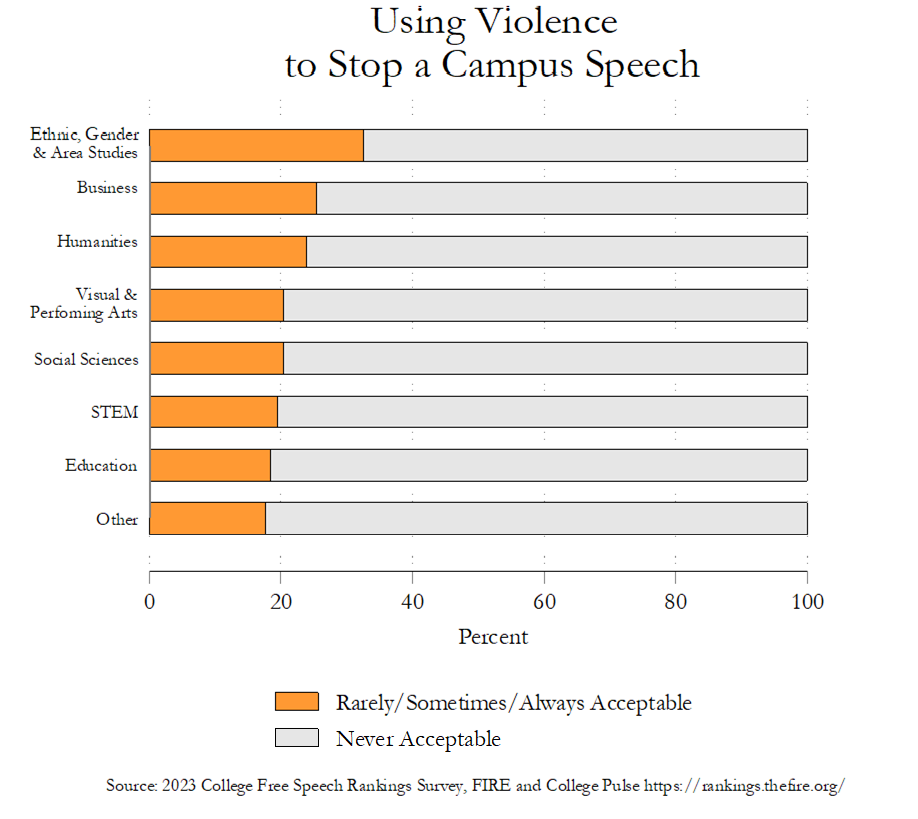
Addendum: Support for Disruption by Major
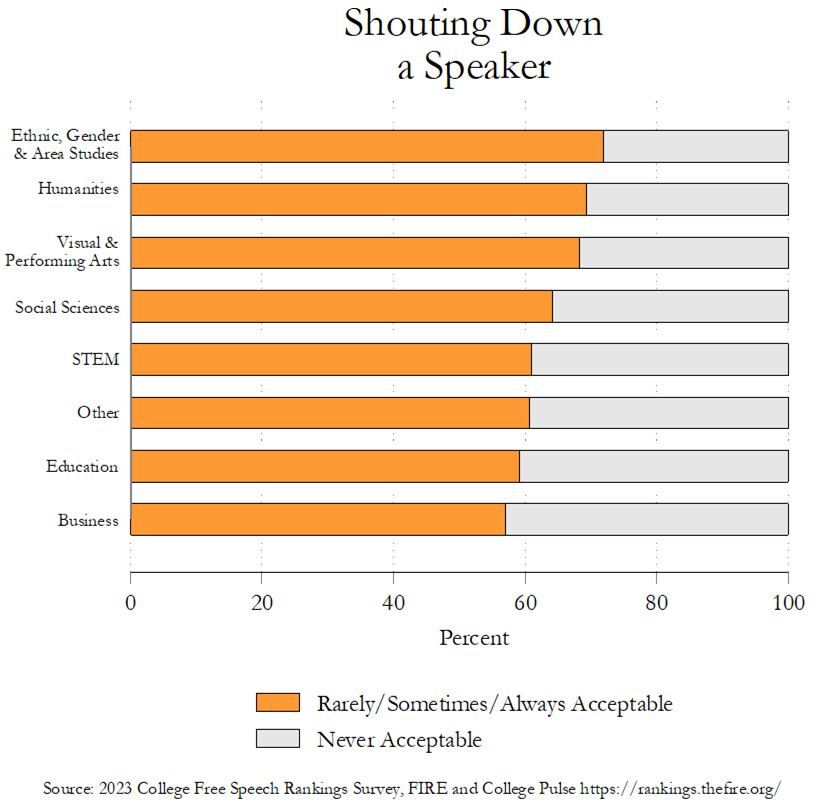
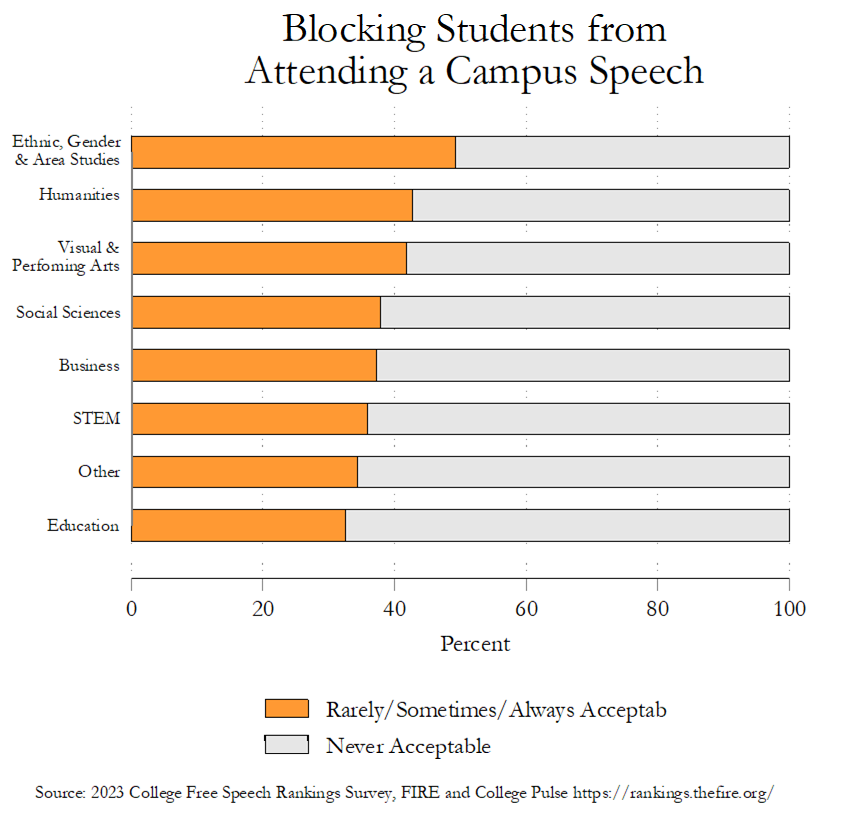
The FIRE survey also asks each respondent about their major. In order to assess whether differences in support for disruptive action vary across majors, I lumped each major into one of eight broad categories: Education, Business, Humanities, the Visual and Performing Arts, Social Sciences, STEM, Ethnic/Gender/Area Studies and “Other” (which includes those who are “Undecided”).
As these graphs show, there are clear differences across majors, with students majoring in Ethnic, Gender, and Area studies far more supportive of disruption than students majoring in other areas.
Thank you to Project Luminas for this suggestion!
The FIRE question about ideology included the standard continuum of liberal to conservative response options as well as options for “Democratic Socialist” and “Libertarian.” Because these options are not found in the CES, I excluded the roughly 6% of respondents who selected these answers from this analysis.
Because the coefficients for the interaction terms in such an analysis cannot be easily interpreted, I present these findings by calculating conditional marginal effects. According to Braumoeller (2004), Brambor et al. (2006), and Kam and Franzese (2007), the significance of the marginal effects is far more important and revealing than the significance of the interaction terms presented in the raw models. When using predicted values in a graph in order to determine statistically significant marginal effects, it is far too conservative to use two separate 95% confidence intervals (Knezevic, 2008). When the standard errors are roughly equivalent, a single 95% test translates into using two sets of 83.4% confidence intervals (Payton et al., 2003).
For the purposes of these analyses, I included “Democratic Socialists” with “liberals” in the category “left” and “conservatives” and “Libertarians” in the category “right.”
The responses from faculty on the Second Amendment and abortion questions are estimated from the FIRE summary.









Great analysis!
What further methods would tease out or explain the elite tolerance of offensive speaker views and their acceptance for disrupting said offensive speakers? One could say it reflects an ideology that says speaker and audience should be heard. I’d love to know if they also think disrupting the disrupters is permissible or tolerable...and independent of your review of the data, I’d love FIRE to breakdown speech climate according to discipline and course (English) experience to compare with faculty ideology to begin to determine in which disciplines students experience intolerance the most and least